
Post Summary
Running a restaurant without dashboards is like driving at night with your headlights off. You might get where you're going, but you're making it unnecessarily difficult and risky.
The best restaurant operators don't rely on gut feelings anymore. They use restaurant dashboard software to turn operational chaos into clarity, catching problems before they become fires and spotting opportunities others miss completely.
This guide walks you through 12 restaurant dashboard examples that matter most, showing you exactly what data to track, how to read it, and what actions to take. Whether you're looking for a restaurant operations dashboard to monitor daily performance or a restaurant KPI dashboard to track critical metrics, these examples will help you build exactly what your operation needs.
.svg)

Priced on per user or per location basis
Available on iOS, Android and Web


What Makes a Restaurant Dashboard Actually Useful
A dashboard is only valuable if it changes how you operate. The best restaurant KPI dashboards share three characteristics:
They answer specific questions. Not "how are we doing?" but "which menu items are killing our food cost?" or "why did Tuesday's labor percentage spike?"
They trigger action. Every dashboard should lead to a decision. If you're looking at data that doesn't change what you do, you're wasting time.
They're built for the people using them. A GM needs different information than a district manager. Your dashboards should match how your team actually works.
The problem most restaurant operators face isn't lack of data. Most restaurant management software generates mountains of it. The problem is turning that data into decisions that improve how you run your operations. That's where effective dashboards for restaurants come in, they bridge the gap between raw data and actionable insights.
The 12 Restaurant Dashboard Examples That Matter Most
These restaurant operations dashboard examples cover everything from real-time sales tracking to long-term financial performance. Each restaurant analytics dashboard serves a specific purpose, helping you monitor, measure, and improve different aspects of your operation.

Category 1: Revenue & Sales Performance
1. Sales Performance Dashboard
This dashboard answers the most basic question every restaurant operator asks: are we making money?
What to track:
- Daily, weekly, and monthly revenue trends
- Sales by daypart (breakfast, lunch, dinner)
- Average check size
- Sales per labor hour
- Year-over-year comparisons
How to read it: Look for patterns, not just totals. A Tuesday lunch that's down 15% compared to last month tells you something specific. Total sales being "lower" doesn't give you anything actionable.
Pay attention to average check size trends. If it's declining while traffic stays flat, your servers might not be upselling effectively or menu pricing needs adjustment.
What action to take: When you spot declining daypart performance, dig deeper before reacting. Is it traffic or check average? Competition or internal execution? The dashboard shows you where to investigate, not necessarily what to fix.
Multi-unit operators should compare location performance within the same market. If one store's lunch is down while others are flat, you're looking at a location-specific issue, not a market trend. This is where multi-unit operations execution becomes critical.
2. Customer Satisfaction Dashboard
Customer feedback is a leading indicator of sales trends. Problems show up in reviews weeks before they show up in revenue.
This restaurant KPI dashboard tracks the leading indicators of sales trends, and problems show up in customer feedback before they impact revenue.
What to track:
- Overall satisfaction scores
- Review platform ratings (Google, Yelp, etc.)
- Comment themes and trending issues
- Response rates to negative feedback
- Net Promoter Score
How to read it: Don't obsess over individual negative reviews. Look for themes across multiple comments. Three mentions of slow service in a week is a signal. One complaint is noise.
Pay attention to the ratio of operational complaints (slow service, wrong order) versus subjective complaints (didn't like the flavor). Operational issues are fixable and urgent. Subjective feedback is valuable but different.
What action to take: Create response protocols for different feedback types. Operations issues should trigger immediate investigation. Consistent themes should drive training or process changes.
Track your response time and resolution rate for complaints. The actual fix matters less than customers feeling heard. Most people who complain and receive a genuine response become more loyal than those who never had a problem. Restaurant reputation management is critical for maintaining positive reviews.
3. Delivery and Online Orders Dashboard
Third-party delivery now represents 20-40% of revenue for many restaurants. You need separate visibility into this channel because it operates differently than dine-in service.
What to track:
- Order volume by platform
- Average delivery time
- Order accuracy rates
- Customer ratings for delivery
- Packaging costs
How to read it: Compare performance metrics between dine-in and delivery. If your Yelp reviews are great but DoorDash ratings are mediocre, you have packaging or communication issues specific to delivery.
Watch delivery times carefully. You control kitchen time but not driver availability. If orders sit ready for pickup beyond your control, consider adjusting your prep timing.
What action to take: Create delivery-specific quality checks that verify packaging integrity, labeling accuracy, and proper bag assembly before orders leave the building.
Track which menu items generate the most delivery complaints and modify recipes or presentation for travel. Food that looks great on a plate doesn't always survive a 20-minute drive. Many ghost kitchens and apps-all-around concepts have solved these challenges.
Category 2: Cost Control & Inventory
4. Food Cost Dashboard
Food cost percentage is one of the few metrics that directly impacts profitability. This dashboard helps you stay on target.
What to track:
- Overall food cost percentage
- Food cost by category (proteins, produce, dairy)
- Waste tracking by source
- Theoretical vs. actual food cost variance
- High-cost menu items
How to read it: Your target food cost depends on your concept, but most full-service restaurants run between 28-35%. The number itself matters less than the trend and variance.
A 2-3% variance between theoretical and actual food cost is normal. Anything beyond that signals portion control issues, waste, or theft.
What action to take: When food cost spikes, start with your highest-volume items. A portion control issue on your top seller impacts margins more than inconsistency on a rarely-ordered dish.
Track waste patterns by shift and station. If dinner prep consistently throws out more than lunch, that's a training opportunity or a par level adjustment. Understanding anticipation inventory helps prevent overproduction.
Xenia's inventory management features help restaurants track food cost in real-time, with photo documentation of waste and automated variance alerts that catch problems before they compound.
5. Inventory and Waste Tracking Dashboard
Most restaurants have no idea how much they're actually losing to waste until they start tracking it systematically.
What to track:
- Waste by category and reason
- Inventory turnover rates
- Over/short variances
- Spoilage patterns
- Receiving accuracy
How to read it: Waste under 2% of food cost probably means you're not tracking accurately. Waste over 5% means you have legitimate problems. The typical range is 2-4%.
Look at waste timing. End-of-night waste suggests overproduction. Mid-shift waste suggests quality control or holding time issues.
What action to take: Require photo documentation of waste. When cooks know they need to photograph what they're throwing away, waste drops immediately. It creates accountability without being punitive.
Track waste by station and shift. Patterns reveal whether you have training issues, equipment problems, or par level miscalculations. Restaurant inventory management software can automate much of this tracking.
Understanding FIFO food safety practices and proper food storage guidelines reduces spoilage and waste significantly.
6. Restaurant Labor Dashboard

Labor typically represents 30-35% of restaurant revenue, making it your largest controllable expense after food cost. A well-designed restaurant operations dashboard for labor gives you visibility into your largest controllable expense after food cost.
What to track:
- Labor cost percentage by daypart
- Scheduled vs. actual hours
- Sales per labor hour
- Overtime hours and costs
- Schedule adherence
How to read it: Labor cost percentage alone doesn't tell the whole story. You need to look at it alongside sales per labor hour. A higher labor percentage during a slow shift might still mean you're understaffed if service suffers.
Watch for overtime patterns. Consistent overtime in one department usually means either chronic understaffing or poor schedule management.
What action to take: Compare your scheduled labor to actual labor. Consistent variances mean either your scheduling process needs work or managers aren't managing call-offs effectively.
Use sales per labor hour to identify optimal staffing levels for different volume ranges. Many restaurants overstaff during slow periods and understaff during rushes because they use fixed ratios instead of volume-based standards. Restaurant forecasting software can help predict staffing needs more accurately.
Category 3: Operations & Compliance
7. Food Safety Compliance Dashboard
Health inspection failures cost restaurants an average of $18,000 in lost revenue, not counting the reputational damage. This dashboard helps you catch problems before inspectors do.
What to track:
- Temperature log completion rates
- Out-of-range temperature incidents
- Cleaning checklist completion
- Equipment maintenance status
- Staff certification expiration dates
How to read it: Perfect completion rates often signal pencil whipping rather than perfect execution. If your temperature logs show 100% completion with zero out-of-range readings for months, your team is probably filling them out without actually checking.
Look for patterns in non-compliance. If walk-in temperatures are missed every Sunday morning, that's a training or scheduling issue.
What action to take: Move from paper logs to digital systems that require real-time documentation. Xenia's food safety software uses time-stamped photo verification to ensure checklists reflect actual conditions, not what staff think you want to see.
When you spot patterns of missed tasks, fix the system before blaming the people. If closing checklists consistently get skipped during busy nights, the checklist is probably too long for the time available. Understanding essential food safety practices helps build better systems.
8. Kitchen Operations Dashboard
Kitchen efficiency directly impacts both guest satisfaction and food cost. This dashboard monitors back-of-house performance.
What to track:
- Ticket times by daypart
- Expo hold times
- Remake percentages
- Equipment downtime
- Prep completion rates
How to read it: Average ticket time hides problems. Look at your distribution. If your average is 18 minutes but 20% of orders take over 30 minutes, you have a consistency problem that guests definitely notice.
Remake percentages above 3-4% usually indicate either training issues or poorly designed tickets. Track which items get remade most often to identify root causes.
What action to take: When ticket times drift upward, check your opening and closing checklists first. Incomplete mise en place at the start of service cascades into slow tickets all night.
Equipment downtime should trigger preventive maintenance reviews. If your flat-top goes down during dinner service, that's a crisis. If it's happened three times this year, that's a maintenance problem.
Xenia's restaurant task management system helps kitchens standardize prep procedures and track equipment maintenance, preventing the small issues that turn into service disruptions.
9. Equipment Maintenance Dashboard
Equipment breakdowns during service create cascading problems. This dashboard helps you prevent them.
What to track:
- Preventive maintenance completion rates
- Equipment age and replacement schedule
- Repair costs by equipment type
- Downtime incidents
- Warranty status
How to read it: Look at the ratio of preventive to reactive maintenance. If you're doing 70% reactive repairs, you're fighting fires instead of preventing them.
Compare repair costs to replacement costs. When an old piece of equipment needs its third $500 repair this year, replacement probably makes financial sense.
What action to take: Create manufacturer-recommended maintenance schedules for every piece of equipment and actually follow them. Most restaurants have the schedules but don't enforce completion.
Xenia's equipment management software automates maintenance reminders and creates accountability through photo-documented completion, helping restaurants shift from reactive to preventive maintenance. Track everything in your restaurant maintenance log.
Category 4: People & Strategic Performance
10. Staff Performance and Training Dashboard
Your team determines everything else on this list. This dashboard helps you develop them effectively.
What to track:
- Training completion rates
- Certification status
- Performance metrics by employee
- Shift lead effectiveness scores
- Tenure and turnover rates
How to read it: Training completion without performance improvement means your training content needs work. Track whether employees who complete training actually perform better on the floor.
High turnover in specific roles or under specific managers reveals problems your exit interviews probably aren't catching. Use employee exit interview checklists to gather better data.
What action to take: Build training paths, not one-time events. New employees should have a clear progression from orientation through role mastery, with checkpoints that ensure they're actually learning. A comprehensive restaurant LMS helps standardize training across locations.
Use performance data to identify training needs. If your servers consistently fail to hit target check averages, they need upselling training. If quality issues spike during certain shifts, those teams need technique refreshers. Start with restaurant server training and waiter training essentials.
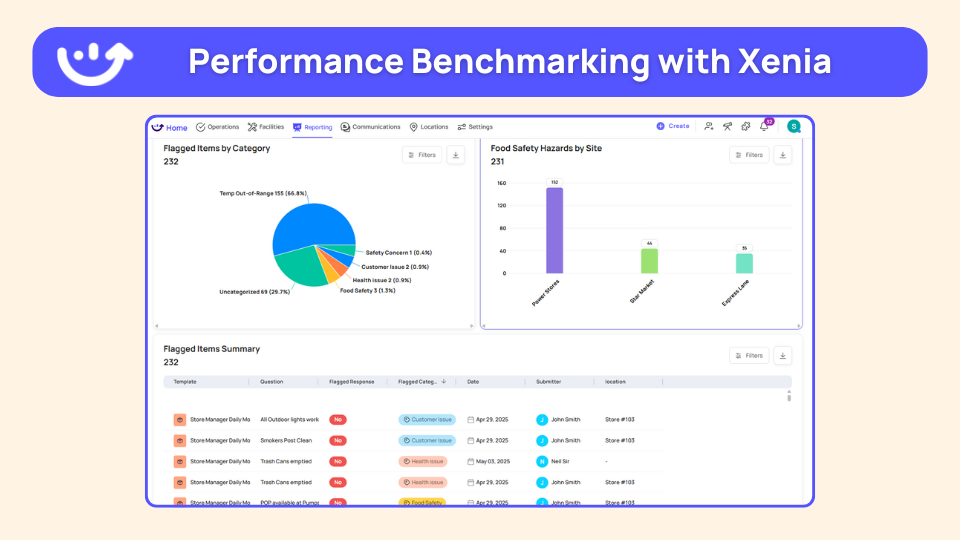
11. Multi-Location Performance Dashboard
Operating multiple restaurants means you need to spot performance outliers quickly and understand why certain locations outperform others.
What to track:
- Revenue comparison by location
- Food and labor cost variances
- Guest satisfaction scores
- Inspection compliance rates
- Manager turnover
How to read it: Don't just rank locations. Look at performance relative to market conditions. Your suburban location doing 20% less volume than your downtown flagship might actually be outperforming when you account for traffic patterns.
Watch for locations that underperform in one category but excel in others. A store with great sales but high food cost might have a strong GM who needs operations training.
What action to take: Use your best-performing locations as learning labs. When one store consistently outperforms, document what they're doing differently and test those practices elsewhere.
Create a system for sharing best practices. Xenia's platform lets operations leaders deploy successful procedures across all locations while maintaining local flexibility where needed. This is essential for multi-unit restaurant management.
12. Financial Performance Dashboard
This executive-level restaurant analytics dashboard consolidates everything into the metrics that matter for long-term viability.
What to track:
- Revenue vs. budget
- Prime cost (food + labor)
- Operating expense ratios
- EBITDA and profitability trends
- Cash flow and working capital
How to read it: Prime cost (food + labor combined) should typically run 60-65% of revenue. If you're consistently above 65%, you either need to increase prices or improve efficiency.
Don't just compare actuals to budget. Compare this month to last month and this year to last year. Trends matter more than single data points.
What action to take: Use this dashboard to have better conversations with your leadership team. Instead of "we need to cut costs," you can say "our prime cost is 68%, which is 3 points above our target, primarily driven by a 2-point increase in food cost since Q3."
Review this dashboard weekly at minimum. Monthly is too late to catch and correct negative trends before they impact profitability significantly. Restaurant weekly reports help maintain this cadence.
How to Actually Implement Restaurant Dashboards
Building dashboards is the easy part. Getting your team to use them is harder.
Start with one dashboard, not twelve. Pick the metric that impacts your business most right now. For most restaurants, that's either food cost or labor cost. Master one dashboard before adding more.
Make dashboards for restaurants accessible where decisions happen. GMs shouldn't need to log into multiple systems or wait for reports. Put critical metrics on displays in the office or deliver them via daily emails. This is where operational dashboards excel over traditional analytics dashboards.
Connect dashboards to action. Every dashboard needs an "if-then" rule. If food cost exceeds 33%, then review top-selling item portions. If labor hits 35%, then adjust tomorrow's schedule. Without action protocols, dashboards just create more work. Your restaurant SOPs should include these protocols.
Review dashboards at regular times. Daily check-ins for operational metrics (sales, labor), weekly reviews for financial metrics (food cost, profitability), monthly deep dives for strategic metrics (training completion, equipment maintenance). Irregular reviews become no reviews.
How Xenia Helps Restaurants Turn Dashboard Data Into Better Operations
Most dashboard software shows you problems. Xenia’s restaurant dashboard software helps you fix them.
.webp)
When your food safety dashboard shows temperature logging compliance dropping, Xenia's mobile-first platform makes it easy for staff to complete logs correctly with photo verification and automatic time stamps that prevent pencil whipping.
When your labor dashboard reveals scheduling inefficiencies, Xenia's task management system helps you build better routines that match actual service volume instead of copying last week's schedule. The platform supports frontline teams with mobile-first tools.
When your multi-location dashboard shows variance across stores, Xenia's analytics identify exactly which procedures aren't being followed consistently, letting you standardize execution without visiting every location. This is critical for restaurant audit software implementations.
Xenia doesn't just display numbers. It provides the operational infrastructure to improve them through standardized checklists, accountability systems, and corrective action workflows that close the loop between identifying problems and fixing them.
Key Xenia dashboard capabilities:
Custom dashboard builder lets you create widget-based reports showing exactly the data you need, automatically emailed to stakeholders without manual compilation. This rivals any dedicated restaurant reporting software.
Pre-built analytics show task completion rates, employee performance metrics, and checklist submission patterns, helping you identify execution gaps quickly.
Weighted scoring assigns different point values to inspection items based on criticality, giving you accurate pictures of true operational risk rather than treating all checklist items equally.
Flagged response tracking categorizes and tracks specific failures across locations and time periods, making it easy to spot recurring issues and address systemic problems. This is essential for effective restaurant audit inspections.
Real-time updates provide live visibility into task completion and inspection progress, allowing managers to monitor multiple locations remotely without constant phone calls. Perfect for general managers overseeing complex operations.
For restaurants operating 10+ locations, Xenia's platform transforms dashboard data from interesting information into actionable intelligence that drives consistent execution across every store. Learn how operational excellence becomes achievable at scale.
FAQs
What is a restaurant dashboard?
A restaurant dashboard is basically a single screen that shows you all your important numbers in one place, sales, food cost, labor percentages, and compliance metrics. Instead of digging through five different systems or waiting for reports, you can see what's actually happening in your operation right now and catch problems before they get expensive.
What metrics should a restaurant dashboard track?
Start with the basics: daily sales by shift, food cost percentage, labor cost as a percentage of revenue, and whether your team is completing temperature logs. Don't try to track everything at once. Pick the 3-5 numbers that matter most to your biggest problem right now, if you're bleeding money on food cost, focus there first.
How do restaurant dashboards help reduce food cost?
Dashboards spot food cost problems fast by showing you waste patterns, inventory variances, and which menu items are killing your margins. They don't fix the problem automatically, they just tell you where to look. If you see waste spiking on dinner shift, you know exactly which kitchen training or prep procedures need attention instead of guessing.
What should a multi-unit restaurant dashboard include?
You need to see how each location compares on the metrics that matter, sales, food cost, labor cost, and compliance rates. The key is spotting outliers fast. If one store's food cost is 5 points higher than the others, you've got a specific problem to fix instead of a market-wide issue.
Conclusion
You don't need all 12 dashboards immediately. You need the one that addresses your biggest operational blind spot.
If you're constantly surprised by food cost overruns, start there. If scheduling feels chaotic and labor percentages fluctuate wildly, that's your priority. If health inspection anxiety keeps you up at night, food safety compliance software is your dashboard.
The best dashboard implementation is the one that actually happens. Start simple, prove value, then expand. Whether you're opening a restaurant or optimizing existing operations, the right dashboard focus matters.
See how restaurant dashboards should work in practice. Schedule a demo to explore how Xenia helps multi-unit restaurants turn operational data into consistent execution across every location, or start your free trial to experience the platform yourself.
Frequently Asked Questions
Got a question? Find our FAQs here. If your question hasn't been answered here, contact us.

Looks like there's no data available in our FAQ section at the moment.

A Modern, AI-Powered Platform Built for Restaurant Operations
Xenia brings kitchen operations, food safety, audits, and team communication into one mobile-first platform. Restaurant teams execute daily work consistently, maintain compliance, and resolve issues faster, while leadership gets real-time visibility across all locations.
.webp)
Why Restaurant Operators Choose Xenia:
🤖 AI-Powered Operations, Convert paper logs instantly and verify food presentation and kitchen cleanliness automatically. Get instant answers about food safety trends without building reports.
🍽️ Food Safety & Compliance, Track line checks and temperature logs with automated alerts. Trigger corrective actions when readings exceed safe ranges. Maintain audit-ready records for health inspections.
📊 Multi-Location Control, Monitor food safety compliance and task completion across regions. Benchmark locations to identify training needs. Export reports for operational reviews.
One platform for kitchen operations, food safety, and compliance across all locations.

.webp)
%201%20(1).webp)

.svg)
%201%20(2).webp)