

A restaurant weekly report summarizes how your location performed over the past seven days. Sales, labor, food cost, compliance, task completion, all in one place.
Most operators already do this. The problem is their report takes two hours to build, goes out Monday morning, and nobody reads it by Tuesday.
That is not a data problem. That is a design problem.
A good weekly report does one thing. It tells you what changed, why it changed, and what you are doing about it. Everything else is filler.
.svg)

Priced on per user or per location basis
Available on iOS, Android and Web


Related Resources
- Restaurant Dashboards: What to Track and How to Use Them
- Restaurant Reporting: A Practical Guide
- Restaurant Task Management: How to Keep Execution Consistent
- How to Improve Restaurant Operations
Why Weekly Reports Matter More Than Monthly Ones
Monthly reports are too slow. By the time you see a problem in a monthly report, you have already lost upto 30 days of revenue.
Weekly reports let you catch things while you can still act on them. A labor cost spike in week two is fixable. A labor cost spike you discover at the end of the month is just a number you explain to your regional manager.
The other reason weekly cadence works is rhythm. When your team knows a report is coming every week, they behave differently. Line cooks complete temperature logs on time. Managers close their checklists. The report is not just a report. It is accountability infrastructure.
If you run more than one location, this matters even more. You cannot be everywhere. Your restaurant reporting system is your eyes and ears across every store.
What to Include in a Restaurant Weekly Report
Not everything. That is the first rule.
A report that tracks 40 metrics tracks nothing. Your team will skim it, pick out the number they like, and move on. Good weekly reports are focused. Here is what actually belongs.
1. Sales Performance
This is the foundation. Every weekly restaurant sales report should cover:
**
Metric, What It Tells You
Total weekly revenue, Overall health of the week
Revenue vs. prior week, Short-term trend direction
Revenue vs. same week last year, Seasonal context
Average check size, Upsell and menu performance
Transaction count, Traffic volume-not just spend
Day-by-day breakdown, Which days need attention
**
You are not just looking for a top-line number. You are looking for the pattern underneath it.
A week where revenue is up 8 percent but transaction count is down 12 percent tells a very different story than a week where both are up. One means your prices or upselling are working. The other means traffic is shrinking.
2. Labor Cost
Labor is typically 28 to 35 percent of revenue in a full-service restaurant. A few points off that target in either direction has a real financial impact across the week.
Your weekly restaurant report should track:
**
Metric, Target Range
Labor cost percentage, 28% to 35% (full service)
Labor cost percentage, 25% to 30% (quick service)
Overtime hours by position, 0 is ideal; flag anything above 5%
Scheduled hours vs. actual hours, Variance shows scheduling accuracy
Sales per labor hour, Efficiency indicator
**
When labor runs high, dig into the day and shift before assuming the week was just busy. A Wednesday where you overstaffed by four people looks very different from a Saturday where overtime kicked in unexpectedly.
3. Food Cost and Waste
Food cost percentage is the ratio of what you spent on food to what you made in food sales. Industry average sits between 28 and 35 percent depending on your concept. Your number should have a target and your weekly report should show you how close you came.
Beyond the percentage, your restaurant operations report should include:
- Total food spend for the week
- Waste log summary (what got thrown out and why)
- Variance between theoretical and actual food cost
- Any spoilage incidents tied to temperature failures
Food cost variance is where you catch problems before they become expensive. If your theoretical cost says 31 percent but you actually ran at 36 percent, something happened. Maybe portion sizes drifted. Maybe there was a theft issue. Maybe the walk-in cooler had a temperature event.
Speaking of which, if you are logging temperatures manually, you are one equipment failure away from a reporting gap. Automated temperature monitoring closes that gap and gives you data you can actually put in a weekly report with confidence.
4. Compliance and Food Safety
A lot of operators leave this out of their weekly reports. That is a mistake.
Your food safety compliance metrics belong right alongside your financial metrics because they carry equal weight when something goes wrong.
Include:
- Number of temperature checks completed vs. required
- Any out-of-range temperature logs and corrective actions taken
- Checklist completion rate by shift and by location
- Any food safety incidents or near-misses
- Health inspection readiness score (if you track this)
One multi-unit operator in the hospitality space noticed through their weekly reports that temperature log completion was consistently lower on Sunday mornings across three locations. The fix was simple: they adjusted the shift lead's opening checklist. But they would never have spotted it without weekly visibility.
5. Task and Checklist Completion
This is the operational heartbeat of your week. Are your teams doing what they are supposed to do?
**
Category, What to Track Weekly
Opening checklists, Completion rate-average completion time
Closing checklists, Completion rate-items missed most often
Cleaning tasks, Scheduled vs. completed
Equipment maintenance checks, Any items flagged or deferred
Training tasks, Completion rate for assigned modules
**
When you see a location consistently missing certain checklist items, that is not an employee problem. That is usually a training gap or a scheduling problem. The weekly report surfaces the symptom; your job is to find the cause.
If you want to see how a digital checklist system connects directly to weekly reporting, Xenia's checklists and SOPs module feeds directly into your analytics dashboard so this data is already waiting for you when you build your report.
6. Audit and Inspection Scores
If your locations run internal audits or receive district manager visits, those scores belong in your weekly report. Weighted audit scores are more useful than simple pass/fail because they show you the relative severity of what failed.
A location that failed three low-weight items and scored 91 is in a different situation than a location that failed one critical food safety item and scored 87.
Xenia's audits and inspections system uses weighted scoring so your weekly report captures the right picture, not just the headline number.
7. Maintenance and Work Orders
Equipment issues have a direct connection to both food cost and labor cost. A broken fryer slows service. A walk-in running warm drives spoilage. A POS system that keeps crashing costs you transaction accuracy.
Your weekly restaurant performance report should capture:
- Open work orders from the past week
- Work orders resolved vs. still open
- Any equipment downtime and its estimated revenue impact
- Preventive maintenance tasks completed on schedule
This is also where you catch deferred maintenance before it becomes an emergency repair. A weekly view of open work orders tells you which items need to be escalated.
How to Structure a Restaurant Weekly Report Template
Structure matters more than most people think. A report that forces the reader to hunt for information will not get read.
Here is a practical structure for a weekly restaurant report template that works for both single-location managers and multi-unit operators:
Section 1: Executive Summary (one page)
- Revenue vs. target
- Labor cost percentage
- Food cost percentage
- Top operational issue of the week
- One thing that went well
Section 2: Financial Performance
- Sales breakdown by day
- Labor breakdown by day and department
- Food cost and waste summary
Section 3: Operations Execution
- Checklist completion rates
- Audit or inspection scores
- Compliance incidents
Section 4: Maintenance
- Open work orders summary
- Equipment issues flagged this week
Section 5: Next Week Priorities
- Top three actions based on this week's data
- Owner for each action
- Target completion date
That last section is what makes a report actually useful. Data without a next step is just a record. If your weekly report does not end with clear actions and clear owners, you have built a history document, not a management tool.
Common Mistakes in Restaurant Weekly Reports
Most operators build their first weekly report template and never change it. Here are the patterns that keep showing up.
Tracking what is easy instead of what matters. Revenue is easy to report. Food cost variance is harder to calculate but more useful. Labor efficiency per hour is harder to pull but worth the effort. Do not default to easy.
No comparison context. A number without context is meaningless. 32 percent labor cost is great in some concepts and a crisis in others. Show the target, show the prior week, show the same week last year. Give the number a frame.
Reports that go to too many people. Your district manager report should not look identical to your kitchen manager report. Different audiences need different levels of detail. Build multiple versions or use a platform that lets different roles see different views.
No corrective action tracking. If week two's report shows the same problem as week one's report, something failed between those two documents. Your weekly report system needs a way to track whether last week's action items actually happened.
Manual reporting that takes too long. If building your weekly report takes more than 45 minutes, you will skip it during busy weeks. The weeks you skip are usually the ones where you most need the data.
For multi-unit operators, Xenia's multi-unit operations platform pulls this data automatically so you are not rebuilding the same spreadsheet every Sunday night.
How to Use Weekly Reports to Improve Restaurant Operations
The data only matters if it changes something. Here is how operators actually use their weekly reports to drive better outcomes.
Catching food cost drift early. When food cost percentage climbs two points in a week, you can investigate now. Ask your kitchen manager about portioning. Check the waste log. Pull the receiving records. Two points caught in week three is recoverable. Two points that ran for six weeks before you noticed is a problem.
Connecting labor cost to revenue patterns. If your report shows that Thursday revenue was 18 percent below the same Thursday last year but your labor hours were nearly identical, you have a scheduling gap. You built for a volume that did not show up. The next week's schedule should reflect that reality.
Identifying training gaps through operational data. When you see the same checklist items missed week after week at the same location, that is a training signal. You do not need to guess about what to train. The report tells you.
Spotting equipment issues before they become failures. A fryer that shows up in three consecutive weekly reports as needing maintenance attention is a fryer that is about to fail at 6pm on a Friday. Preventive maintenance tracking in your weekly report is how you stay ahead of that.
Benchmarking locations against each other. If you run five locations and one consistently runs food cost 4 points below the others with similar menu pricing, you should be studying that location. What are they doing differently? That kind of insight only comes from having a consistent weekly report across all locations.
How Xenia Helps You Build and Automate Restaurant Weekly Reports
Most operators spend more time building the weekly report than reading it. Xenia fixes that.
Your teams complete checklists, temperature logs, work orders, and audits in the platform. That data feeds directly into your reports. No spreadsheet. No tracking down numbers from five different systems on a Sunday night.
Two AI capabilities do more than surface data.
The first is AI-Powered Summaries. You skip the rows and get a plain-language health report that tells you what needs attention first. It pulls from task completion rates, audit scores, temperature events, and open work orders and gives you something you can act on in minutes.
The second is the Analytical Agent. Ask it a question the way you would ask a colleague: which location had the lowest checklist completion this week, where are food safety flags trending up, what changed between last week and this one. It runs the query and gives you a direct answer. No pivot tables. No manual digging.
The Xenia analytics dashboard puts all your locations in one view. Sort by any metric in seconds and drill into a specific location without switching screens.
When it is time to share the report, PDF export and scheduled email delivery handle distribution automatically. Your GM, your district manager, and your ownership group each get the version they need. Nobody has to compile or send it by hand.
The report runs itself.
Conclusion
A weekly report is only useful if it drives decisions.
If yours takes hours to build, nobody reads it, or it never leads to action, something needs to change. Start simple. Track fewer things. End every report with clear next steps and clear owners.
That is the difference between operators who use data and operators who just store it.
If you want reporting that runs itself, Xenia connects your daily operations to automatic weekly reports. No spreadsheets. No manual work. Just a clear picture of every location, every week.
Book a demo and see it in action.
Frequently Asked Questions
Got a question? Find our FAQs here. If your question hasn't been answered here, contact us.
What do you do when weekly report data looks wrong?
Trace it to the source before assuming a performance problem. High food cost could be a missing invoice. A compliance drop could be a logging error. Fix the source first, then correct the numbers.
How long should a restaurant weekly report take to review?
Under 15 minutes. If it takes longer, it is too long. Lead with an executive summary so anyone can get the full picture in two minutes.
Who should receive the restaurant weekly report?
Not everyone needs the same version. GMs need the full report. District managers need a cross-location ranking. Owners want a one-page snapshot. Sending everyone the same document creates noise.
What is the difference between a restaurant sales report and a restaurant operations report?
A sales report covers revenue and transactions. An operations report adds compliance, task completion, audits, and maintenance. Your weekly report should combine both since financial results and operational execution are directly linked.


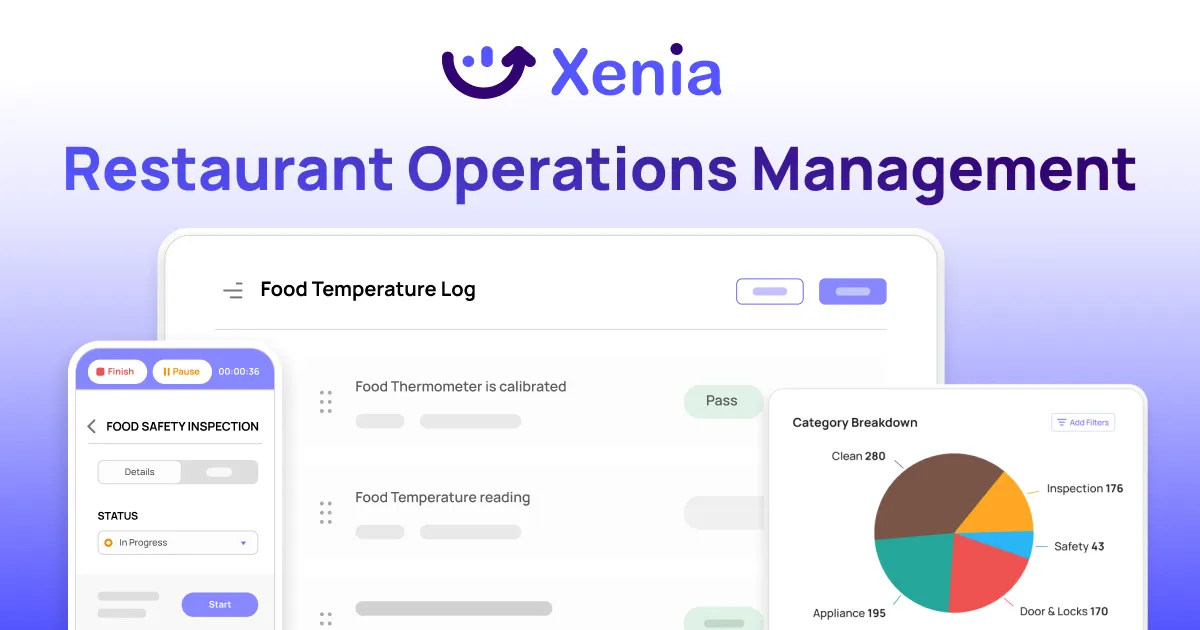
A Modern, AI-Powered Platform Built for Restaurant Operations
Xenia brings kitchen operations, food safety, audits, and team communication into one mobile-first platform. Restaurant teams execute daily work consistently, maintain compliance, and resolve issues faster, while leadership gets real-time visibility across all locations.
.webp)
Why Restaurant Operators Choose Xenia:
🤖 AI-Powered Operations, Convert paper logs instantly and verify food presentation and kitchen cleanliness automatically. Get instant answers about food safety trends without building reports.
🍽️ Food Safety & Compliance, Track line checks and temperature logs with automated alerts. Trigger corrective actions when readings exceed safe ranges. Maintain audit-ready records for health inspections.
📊 Multi-Location Control, Monitor food safety compliance and task completion across regions. Benchmark locations to identify training needs. Export reports for operational reviews.
One platform for kitchen operations, food safety, and compliance across all locations.

.webp)
%201%20(1).webp)

.svg)
%201%20(2).webp)