🎉 Xenia raises $12M Series A and announces 2 new AI capabilities

Learn More

White cross or X mark on a black background.
Reporting & Analytics

Know exactly how every location is performing, In Real Time.

Xenia turns daily task, audit, and work order activity into live dashboards and scheduled reports, so above-store leaders see across every site and fix issues before they spread.

Xenia Mockup
Trusted by 300+ multi-location brands | 12,000+ stores managed daily
Pitfire Pizza LogoPrince Street Pizza logoService Source LogoTwin Peaks Hospitality LogoTexas State Technical College LogoEconomos Properties LogoDemos BrandsLongspar RanchSCL LogoTipsy Putt LogoGrand Mercure LogoPlatinum Companies LogoHyatt PlaceDemos Brands LogoElevate Vacations LogoHampton Inn LogoPower Works LogoDesi LogoBavarian Bierhaus LogoKempinski Hotel Logo WhiteBluefield Bay Villas LogoChateau Mar Logo
Newk's Eatery
Power Market
Domino's Pizza logo with a red domino tile and blue tile featuring the brand name.
Dave Hot Chicken
Red Chick-fil-A logo with stylized chicken head forming the letter C.
Slim Chickens
Tipsy Putt
Huck's Market
Mach 1
OnCue
Adidas
Newk's Eatery
Power Market
Domino's Pizza logo with a red domino tile and blue tile featuring the brand name.
Dave Hot Chicken
Red Chick-fil-A logo with stylized chicken head forming the letter C.
Slim Chickens
Tipsy Putt
Huck's Market
Mach 1
OnCue
Adidas
Newk's Eatery
Power Market
Domino's Pizza logo with a red domino tile and blue tile featuring the brand name.
Dave Hot Chicken
Red Chick-fil-A logo with stylized chicken head forming the letter C.
Slim Chickens
Tipsy Putt
Huck's Market
Mach 1
OnCue
Adidas

One reporting layer across your locations

Above-Store Dashboards
  • Every location's performance in a single view
  • Drill down by region, district, and site
  • Role-specific views for COO, DM, and store manager
Task Summary Dashboard
  • Live task counts by status across all locations
  • Dynamic bar and pie charts by category and site
  • Filter by date, status, assignee, category, and location
Employee Productivity Dashboard
  • Task volume and completion for every member
  • Employee leader board
  • Advanced Filters
Template Submission Dashboard
  • Live submission counts by template
  • Template submission summary table
  • Filter on date range, status, employee and template
Work Order Summary
  • Every work order across all sites in one place
  • Advanced filters by location, status, assignee, and asset
  • Export to PDF or Excel in one click
Audit & Inspection Scores
  • Weighted scoring with configurable A / B / C grades
  • Score trends by site against your org average
  • Failed items flagged and routed to corrective actions
User interface showing a Task & Work Orders dashboard with tasks like Kitchen Inspection, Fix front door, and Window cleaning, each with status, category, and priority levels; also displaying a mobile screen to create a new task for Oven Cleaning with options to add images, checklist, assignee, and buttons to cancel or create the task.
Work Order Dashboard

Turn every work order into a clear operational record

Organize every report with resizable, drag-and-drop columns built for how you review
Generate comprehensive PDF work order reports that support faster, better-informed operational decisions
Filter work order summaries by date, status, assignee, category, location, and asset
Export work order lists to Excel to analyze trends or share with stakeholders
Get Started for Free
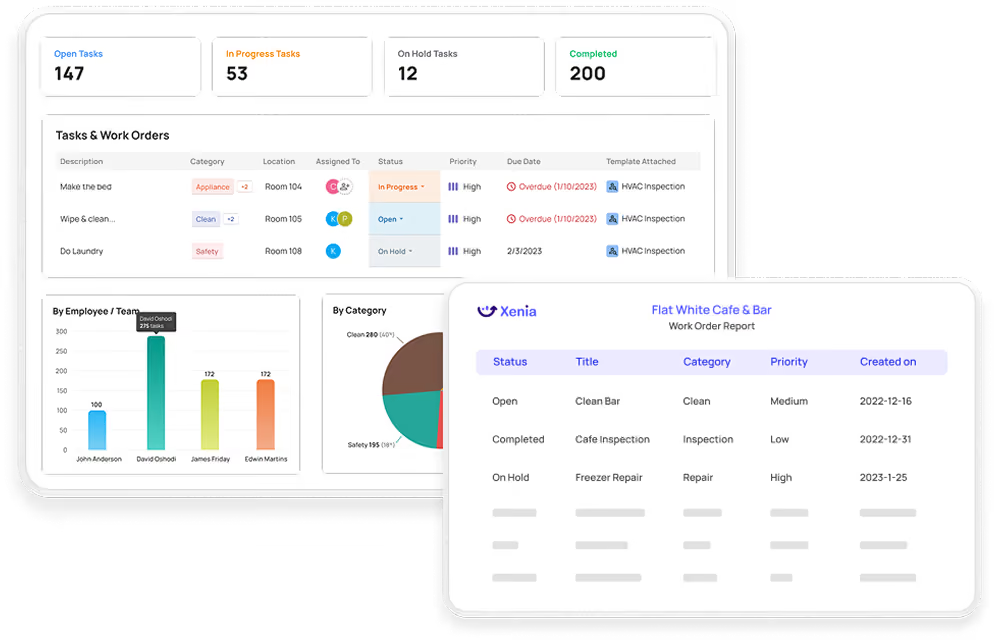
Dashboard showing task summary with 147 open tasks, 53 in progress, 12 on hold, and 200 completed; task list with descriptions, categories, locations, assigned persons, statuses, priorities, due dates, and templates; bar chart of tasks by employees with David Oshodi leading; pie chart of tasks by category; and team task count leaderboard.
Task Summary Dashboard

See what is getting done across every location, as it happens

Monitor real-time task status across every location from a single above-store dashboard
See your most common work categories at a glance with dynamic pie charts
Compare workload and completion across teams and locations with dynamic bar charts
Filter the dashboard by date, status, assignee, category, asset, and location
Get Started for Free
Xenia Analytics Mockup
Employee Productivity Dashboard

Understand and improve how your every team performs

Track task volume and completion rates for every team member across sites
Surface your star performers instantly with a live, ranked task-count leaderboard
Compare productivity across individual locations, districts, and regions in one view
Use advanced filters to drill down on any team member, date, status, etc
Get Started for Free

Try Xenia Out For Free and Streamline Operations

Ready to manage work more efficiently? No Credit Card Required
4.9/5 stars based on reviews from
Xenia Anlaytics Mockup
Checklist Report Exports

Get a defensible record from every checklist and log

Keep complete audit trails with unlimited history for compliance and inspections
Export detailed, shareable PDF reports for any checklist or inspection completion
Track hazards, incidents, and shift notes in structured, searchable digital logs
Schedule reports to generate and send automatically, with no manual pulling
Get Started for Free

Explore more of Xenia

Blue circular arrows forming a reload or refresh icon on a transparent background.
Preventive Maintenance
Asset maintenance schedules and procedures
Learn more
Pink calendar icon with a spiral top and three horizontal lines representing text.
Inspections and Audits
Formalize procedures and log work history
Learn more
Xenia Mockup
Xenia Mockup
Xenia Task Dashboard Mockup
Xenia Mockup
🎉 Xenia raises $12M Series A and announces 2 new AI capabilities

Learn More

White cross or X mark on a black background.
Why Choose Xenia?
Analytics & Reporting

Turn Operational Data ‍Into Better-Run Locations

Build the dashboards you want, get real-time visibility across every site, and let AI surface the recurring issues holding a location back, all in one platform built for multi-unit operators.

Turn completion, audit, and work order data into the decisions that make every location run better.

Build the Exact Dashboard Each Leader Needs, Without IT or Tableau

Build dashboards from scratch with widget-based charts: line, pie, bar, number, and tables
Give the COO, regional director, and store manager each their own dashboard view
Slice and filter any report by location, region, district, date range, category, or asset
Configure it once yourself instead of waiting on a vendor to build every report
Keep an unlimited history of every submission, with no data expiring after two years
Get Started for Free ->
Dashboard showing task summary with 147 open tasks, 53 in progress, 12 on hold, and 200 completed; task list with descriptions, categories, locations, assigned persons, statuses, priorities, due dates, and templates; bar chart of tasks by employees with David Oshodi leading; pie chart of tasks by category; and team task count leaderboard.

See Which Locations Are on Track Right Now, Not Next Week

Open one morning view that flags which locations have issues before you ask
Track live completion rates by site, so you know the work actually got done
Compare performance across every location to separate your strong sites from your strugglers
Verify remotely with live photos and completion data, without driving to each store
Get real-time alerts the moment a task is missed or a check fails
Get Started for Free ->

Find the Recurring Problem Dragging a Location Down

Move past point-in-time snapshots to trend performance across weeks, months, and quarters
Surface repeat offenders by seeing the same failed item appear again and again
Drill from a headline number into the individual submission and photo behind it
Connect daily task data with audit scores to find what is really causing misses
Score and benchmark stores, franchise groups, and regions against your organization-wide average
Get Started for Free ->

Set Your Schedule Once and Get Every Report Delivered Automatically

Schedule reports on your own fiscal calendar, including non-standard 13-period cycles
Deliver role-appropriate reports straight to each leader's inbox without anyone touching the data
Send weekly email summaries with a dashboard snapshot and an Excel attachment
Export to PDF, Excel, or CSV, or pipe raw data into your BI tools
Retire the manual work of exporting, reformatting, and beautifying reports every period
Get Started for Free ->
Xenia AI

AI-Powered Reporting and Analytics

Xenia's AI does the analysis for you, turning raw operational data into plain-language answers, automated briefings, and trustworthy numbers, so leaders act on insight instead of building reports by hand.

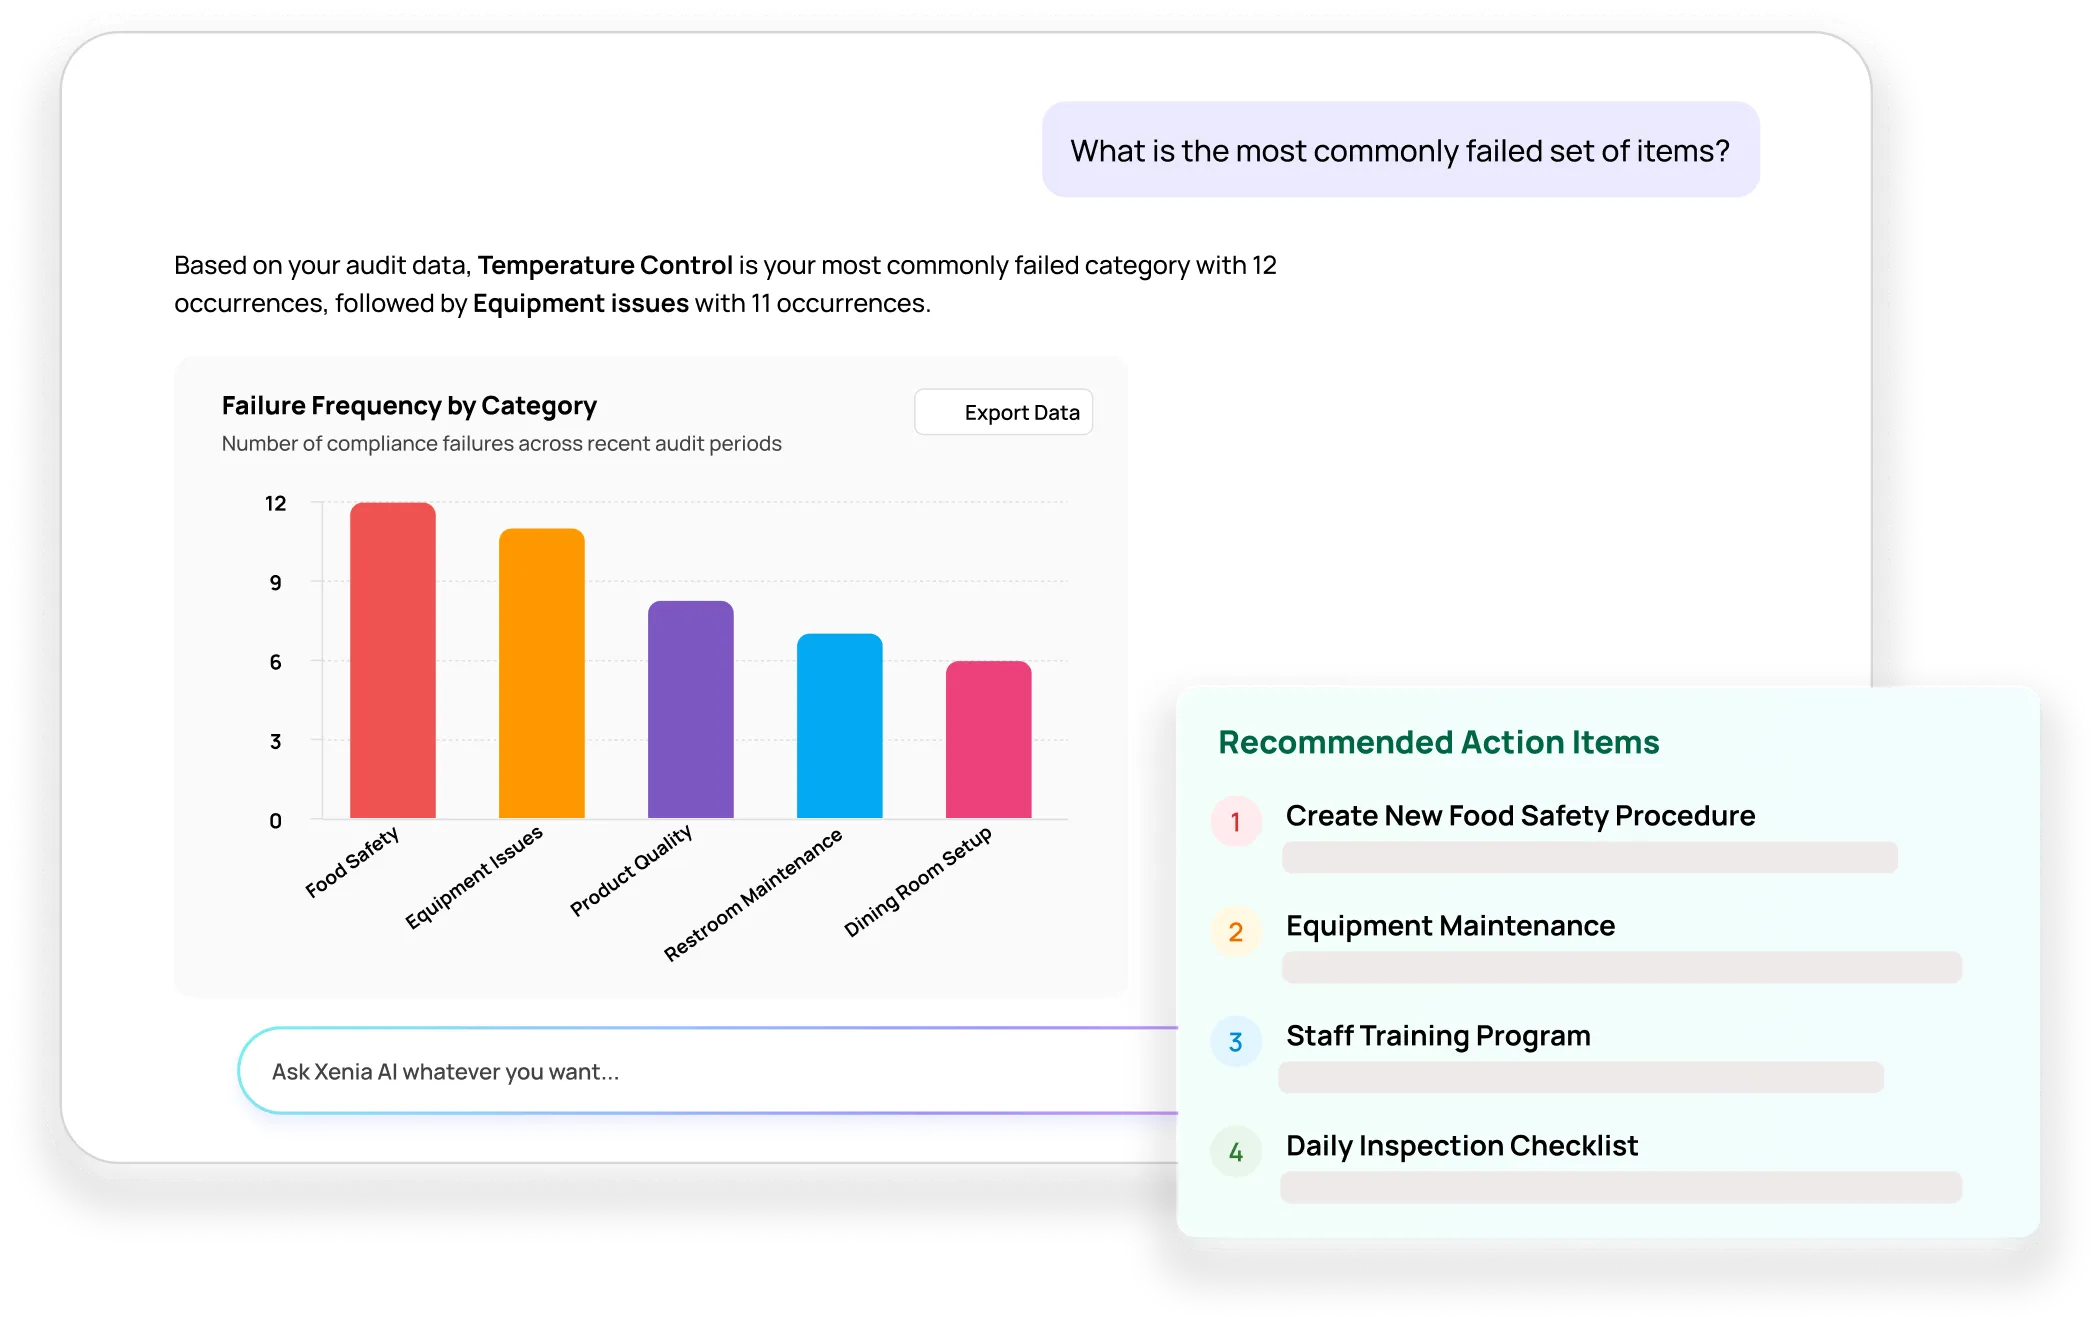
Ask a Question, Get an Answer With Charts

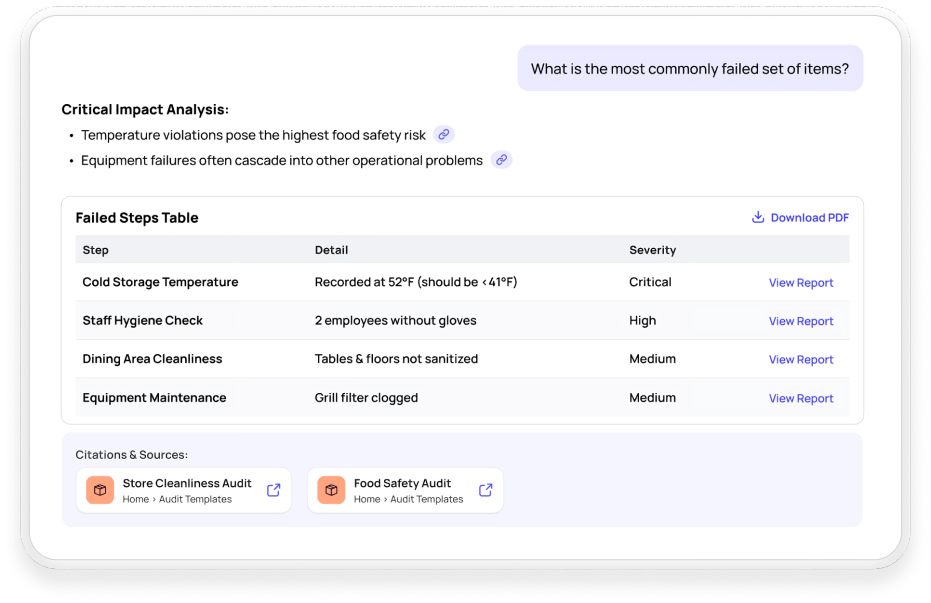
Ask things like which locations are below average this month, or what item fails most across the network, in plain language. Our Analytical Agent answers instantly with charts and generates the report for you, no Tableau or SQL required.

Automated Briefings, Waiting in the Inbox

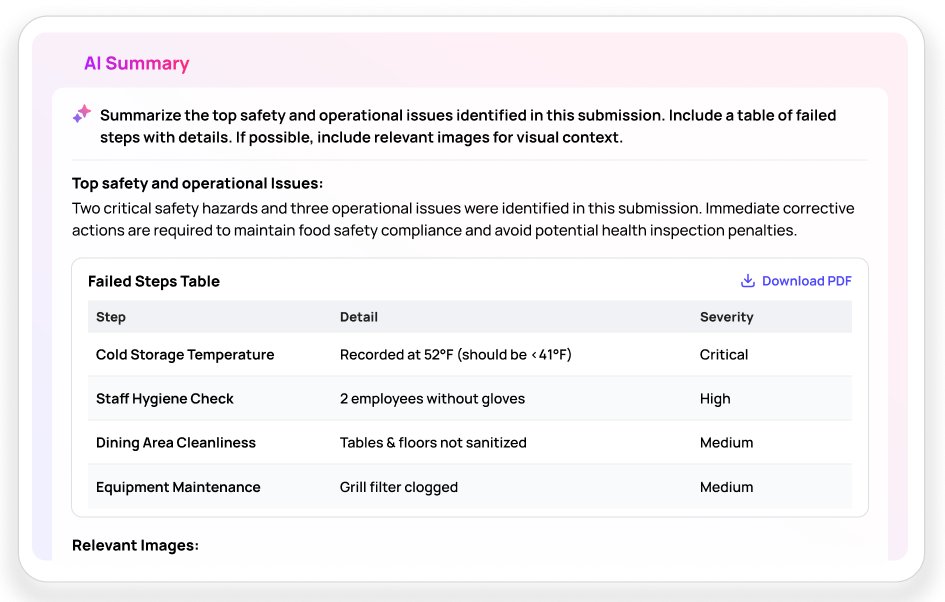
Replace the weekly data pull with AI-generated daily or weekly executive dashboards. Our Summaries feature highlights your critical issues, compliance trends, and location performance, and points leaders to where they should focus before problems escalate.

Trust the Numbers Behind Every Report

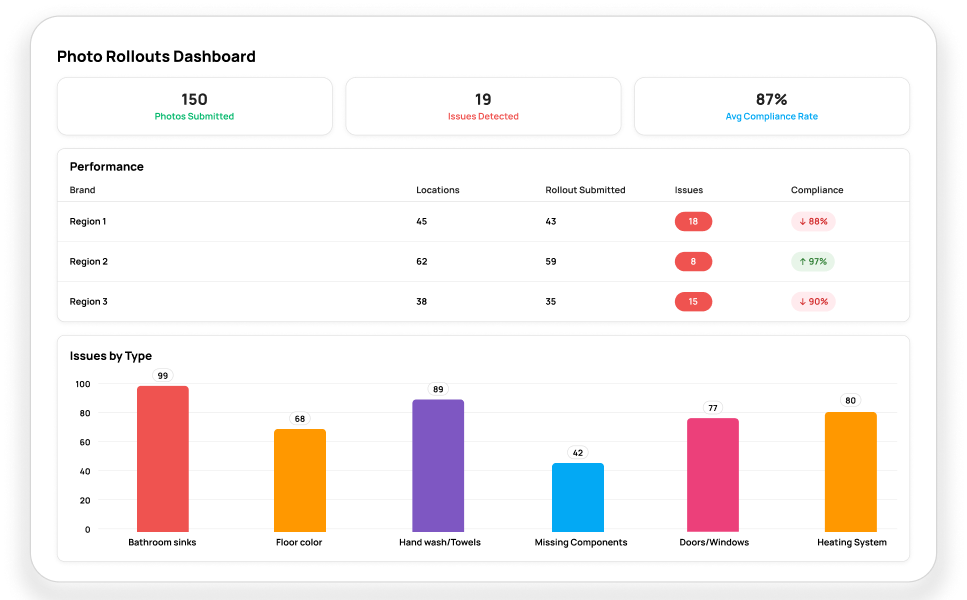
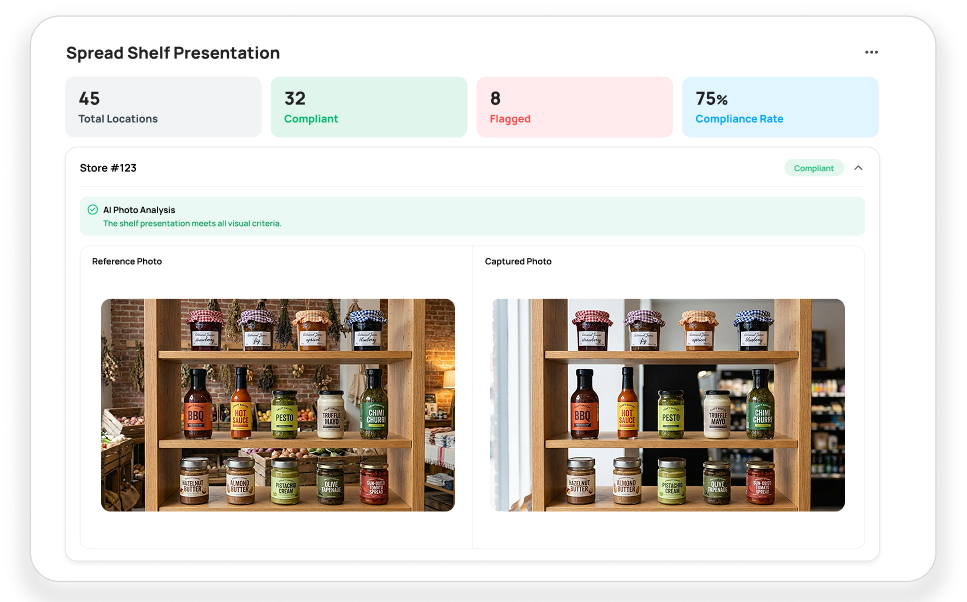
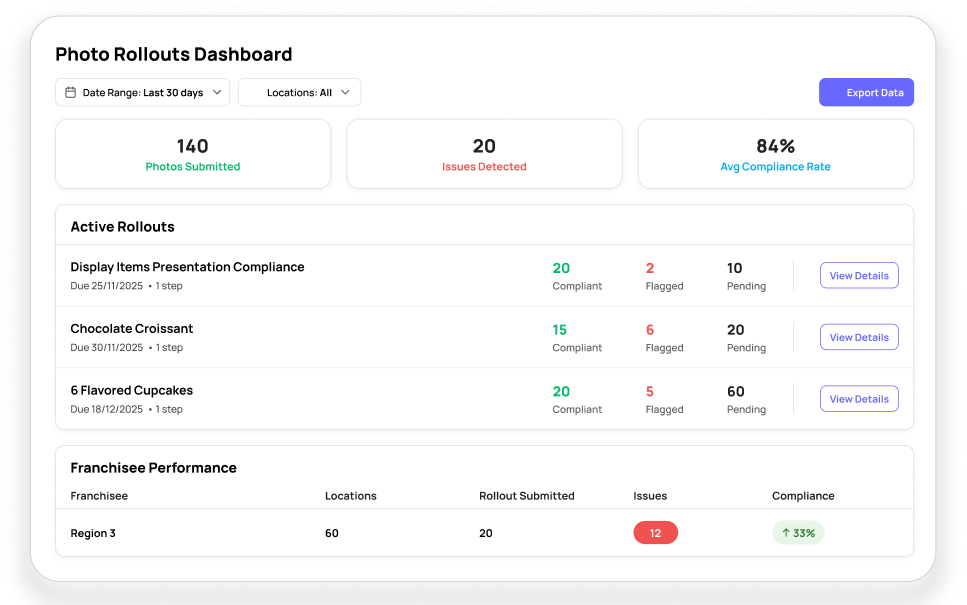
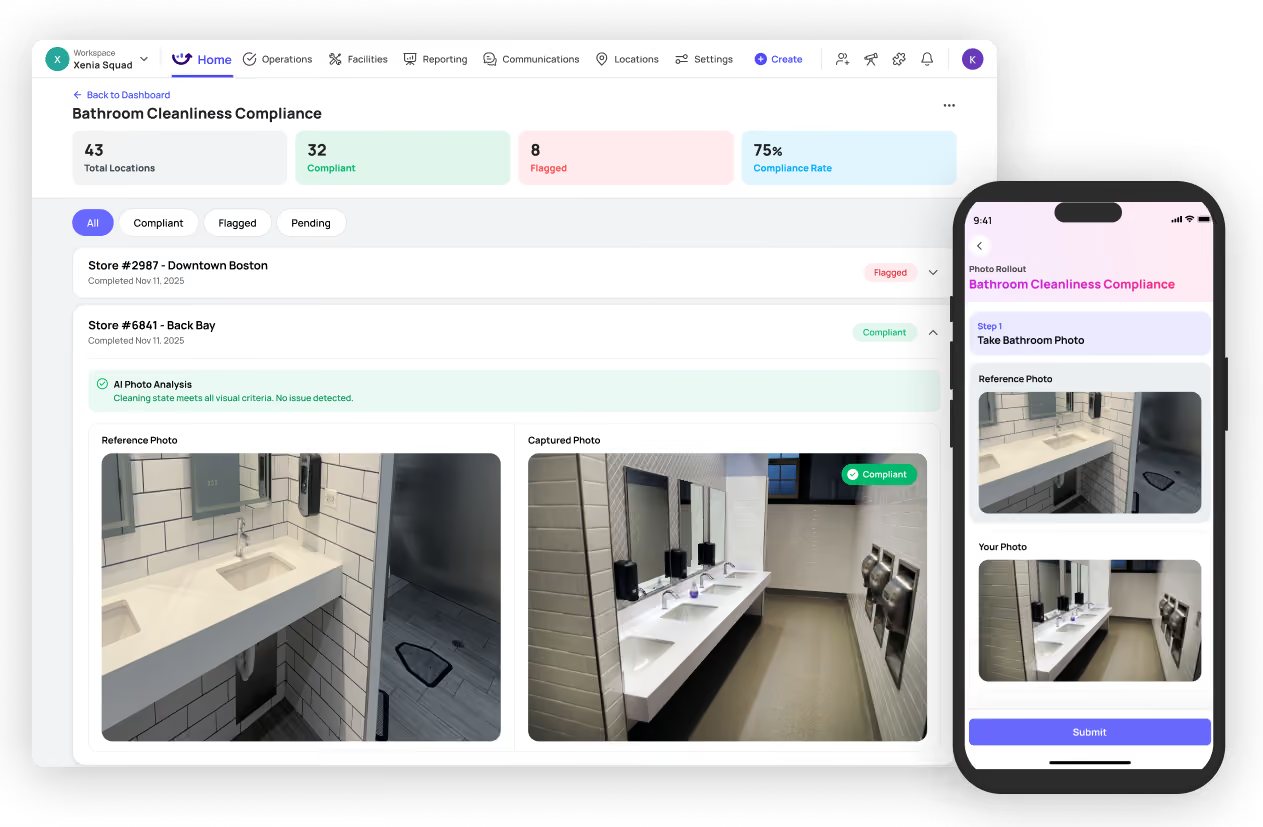
Reports are only as good as the data feeding them. Our AI Photo Rollouts feature reviews submitted photos to verify brand standards and catch pencil-whipping, so your completion and audit scores reflect what is really happening in each store.

Learn More

How Leading Brands Run Smoother
Operations With Xenia

Power MarketTipsy PuttNewk's EateryHillStone Restaurant GroupBacari

360+

Locations Digitized

Power Market completely transformed operations from manual paper-based systems to automated digital workflows across the entire network.

100%

Process Automation

Eliminated manual HR approvals, task routing, and operational checklists, reducing administrative overhead and increasing accountability.

Multi-Format Standardization

Xenia unified Power Market's operations across diverse store types, including beer caves, car washes, and regional layouts with consistent standards.
"We moved everything from paper to online... from verbal checklists and instructions into scheduled tasks and scheduled checklists. Xenia helps automate everything."
Fidaa Mohrez
Senior Director of Operational Systems, Power Market

40%

Faster Task Resolution

Operational tasks resolved 40% faster with digital checklists and automated task-tracking systems.

100%

Staff Adoption

Complete adoption across all locations with bilingual checklists and QR code access for instant process deployment.

30%

Admin Reduction

Reduced administrative time through streamlined communication and automated documentation, ensuring consistent safety and cleanliness standards.
“Xenia enabled us to document our daily processes digitally, making the deployment of consistent operating processes & checklists across our restaurants instantaneous.”
Owner
Multi-Unit Operator, Tipsy Putt

100+

Franchise Locations

Franchise locations with streamlined digital audit processes, replacing manual Excel-based Rose Reports completely.

Automated Scoring

Significant time savings through automated audit scoring calculations and professional PDF report generation with photos.

Digital Transformation

Eliminated manual calculations and streamlined the field audit process for both Rose Reports and line checks.
"We've got a lot of manual stuff going on, but as we get bigger, we're going to have to look at this in a more streamlined fashion. Xenia saves us a ton of time with the platform."
Brad Forsythe
Field Business Consultant, Newk's Eatery

40+

Restaurant Locations

Restaurant locations with streamlined digital audit processes ensure consistent operational excellence and quality standards.

Automated Scoring

Digital audit process with automatic scoring calculations, eliminating manual processes and enhancing documentation accuracy significantly.

Quality Assurance

Standardized quality monitoring across all locations, maintaining consistent service standards and operational excellence benchmarks.
"The digital audit process has transformed how we maintain quality standards across our locations. Xenia's automated scoring saves us significant time while ensuring consistent operational excellence."
Operations Manager
Field Operations, Hillstone Group Restaurants

100%

Daily Operating Compliance

Compliance with daily operating checklists was achieved across all 8 Bacari restaurant locations through standardized protocols.

Centralized Communication

Eliminated fragmented communication channels by consolidating all operational processes into one unified platform for seamless information flow.

Enhanced Training Efficiency

Streamlined employee onboarding and training processes, ensuring consistent delivery of Bacari's service standards across all locations.
"Xenia has revolutionized how we operate at Bacari Restaurants, seamlessly integrating every aspect from daily checklists to training and equipment management. It's not just a tool; it's our recipe for maintaining excellence across all our locations."
Deputy Director of Operations
Bacari Restaurants

Ready to See Every Location Clearly?

Stop wrangling spreadsheets and waiting on week-old reports. Xenia gives multi-unit leaders custom dashboards, real-time visibility, trend analysis, and AI insights across every location, with free migration, flexible month-to-month plans, and a dedicated success manager.
Xenia Mobile Agenda Mockup
Woman in apron on Tablet