
You're managing five restaurant locations. Sales data comes from your POS. Labor numbers live in your scheduling app. Food costs hide in your inventory system. Compliance checklists sit in someone's email.
Everything exists separately. You need a way to connect it all.
That's the reality for most multi-unit restaurant operators. You have data everywhere but insights nowhere.
Restaurant reporting fixes this. It pulls everything together so you can actually see what's happening across your business. Clear answers to the questions that keep you up at night.
This guide shows you exactly how to build reporting systems that work for real restaurant operations.

.svg)

Priced on per user or per location basis
Available on iOS, Android and Web


What Is Restaurant Reporting?
Restaurant reporting means collecting data from your operations and turning it into information you can actually use.
Think of it this way. Your POS tracks sales. Your inventory system monitors food costs. Your scheduling tool counts labor hours. Restaurant reporting brings all those numbers together and tells you what they mean.
For single locations, this might be simple spreadsheets. For multi-unit operations, you need something more sophisticated. You need systems that track performance across every location and show you where things are working and where they're not.
Here's what good restaurant reporting does:
- Shows you opportunities before you miss them
- Compares how different locations perform
- Tracks whether you're hitting your targets
- Saves you time with automated insights
- Gives you facts to support your decisions
The goal isn't collecting numbers. The goal is making better decisions. Better decisions start with better information.
Why Restaurant Reporting Matters For Your Business
Managing one restaurant is completely different from managing ten. You can't walk every floor. You can't watch every shift. You need data to show you what's happening.
How Reporting Helps You Grow
Your downtown location's food costs changed 8% last month. With proper reporting, you see it the same day and can investigate right away.
Someone asks about labor cost optimization. You have the data ready to show exactly where you stand and what improvements are possible. Your best manager wants to understand why their location performs differently. You can compare locations fairly and share insights that help everyone improve.
These opportunities become visible with proper restaurant reporting and analysis.
What Changes With Good Reporting
You catch trends immediately. Food costs shift at one location. You see it the same day and can investigate right away.
You know which locations are ready to scale. Performance reports show you exactly where each site stands compared to your benchmarks.
You make faster decisions. Restaurant reports deliver information automatically so you can act quickly on opportunities. You prove ROI to investors. Detailed restaurant industry operations reports show stakeholders you're running things efficiently.
You save time for strategic work. Automated reports for restaurants give you hours every week that you can spend actually improving operations.
The restaurant industry runs on tight margins. The operators who thrive are the ones who use data to stay ahead. That starts with solid reporting systems.
The Essential Restaurant Reports You Actually Need
Some reports give you critical insights. Others provide nice-to-have information.
Here are the reports that actually move the needle for multi-unit operations.
Sales and Revenue Reports
These show you where money comes from.
Track daily sales by location. Track revenue by daypart. Track performance by channel like dine-in, takeout, and delivery.
This helps you spot patterns fast. Tuesday lunch sales show consistent trends across three locations. You can optimize for this. Weekend dinner sales are climbing. Time to adjust staffing and inventory.
Labor Cost Reports
Labor typically represents 25-35% of your revenue. Optimizing here creates meaningful impacts on profitability.
Track these labor metrics:
**
Metric, Why It Matters
Total labor costs by location, Shows you which sites run efficiently
Labor as percentage of sales, Helps you maintain target ratios
Overtime hours and costs, Identifies scheduling optimization opportunities
Costs by position and shift, Pinpoints where labor spending goes
**
Good labor reports help you optimize restaurant scheduling while maintaining service quality.
Food Cost and Inventory Reports
Food cost percentage directly impacts restaurant profitability. Most concepts target 28-35%.
These reports track what you spend on ingredients. They track what you sell them for. They show inventory sitting in your walk-ins.
Tracking $500 in weekly produce waste means you can recover $26,000 yearly by optimizing inventory management. Food cost reports help you spot these opportunities before they impact your margins.
Prime Cost Reports
Prime cost combines food and labor costs. It's your most important restaurant performance indicator.
These two expenses typically consume 60-65% of revenue.
Here's what your prime cost tells you:
**
Prime Cost %, What It Means
Under 60%, Excellent - you're running tight operations
60-65%, Good - industry standard range
Over 65%, Opportunity - room for optimization
**
Restaurant operators monitor this number closely. It directly impacts profitability and growth potential.
Restaurant Performance Index Reports
The restaurant performance index (RPI) combines multiple metrics into one overall health score for each location.
What is the current RPI? It varies by concept and market.
But it typically includes same-store sales growth, customer traffic trends, average check size, and table turn rates.
Think of the restaurant performance indicator as your location's vital signs. One glance tells you if a site is healthy or ready for improvement.
These restaurant performance reports help you quickly identify which locations are thriving and which are ready for optimization.
Operational Compliance Reports
Track whether managers are completing opening checklists. Monitor if food safety protocols are being followed. See if equipment maintenance gets done.
Compliance reports track task completion rates. They track safety protocol adherence. They track cleanliness scores.
This matters because maintaining high health inspection scores builds customer trust, protects your reputation, and ensures smooth operations.
Restaurant compliance reporting shows you which managers execute standards consistently and which teams might benefit from additional training.
Customer Satisfaction Reports
Strong operations need happy customers to drive sustainable growth.
Track Net Promoter Score. Track average review ratings. Track response times to guest feedback. Track common themes in reviews.
Monitor satisfaction across locations so you can celebrate wins and address improvement opportunities before they impact your reputation.
How To Build Restaurant Reporting Systems That Work
Setting up restaurant reporting is about building systems that fit how your business actually operates.
It's about creating sustainable processes that give you the insights you need.
Start With Your Most Important Metrics
Focus on tracking 5-7 metrics that most directly impact profitability.
For most multi-unit restaurants, start here:
- Total sales and sales per location
- Food cost percentage
- Labor cost percentage
- Prime cost
- Customer satisfaction scores
- Compliance task completion rates
- Average check size
Master these first. Add more as your reporting matures and your team gets comfortable with data.
Connect Your Data Sources
Your POS system holds sales data. Your inventory software tracks food costs. Your scheduling app monitors labor. Your task management tools track compliance.
These systems work better when they communicate with each other.
You benefit from integration because:
- Data flows automatically between systems
- You eliminate manual data entry
- Reports update in real-time
- Everyone sees the same numbers
Look for platforms that connect with your existing tools. Or consider unified solutions that handle multiple functions in one place.
Automate Everything You Can
Manual reporting takes hours every week.
Set up automated restaurant reports that generate and deliver themselves on schedule.
Build this automation routine:
**
Frequency, Report Type, Who Gets It
Daily, Sales by location, All managers and executives
Weekly, Labor cost analysis, District managers and HR
Weekly, Food cost trends, Kitchen managers and buyers
Monthly, Full restaurant performance report, Executive team
Monthly, Compliance scorecards, Operations directors
**
This ensures consistent monitoring. Your team can focus on taking action instead of compiling data.
Make Reports Easy To Understand
Clear restaurant operations reports present information visually. Use charts and graphs instead of just numbers. Color code everything.
Green for hitting targets. Yellow for approaching thresholds. Red for areas needing attention.
Add clear benchmarks so people know what good looks like.
Your managers should glance at a report and immediately understand what's working and what's ready for improvement.
Set Clear Benchmarks and Targets
Data needs context to be meaningful.
A 32% food cost. Is that good or ready for optimization? Depends on your concept.
Set targets for every metric based on your business model. Adjust for market conditions. Align with industry standards.
Then track actual performance against those targets in every report. This turns abstract numbers into actionable insights.
Review Reports With Your Team Regularly
Restaurant reporting works best when people actively use the information.
Build this rhythm:
Weekly calls to discuss key metrics. Monthly deep dives into performance by location. Quarterly strategy sessions based on trend analysis.
Make reporting part of your operational culture. A tool that drives continuous improvement.
Common Restaurant Reporting Challenges And Solutions
You might encounter some obstacles when building your reporting systems. Here's how to handle them.
Challenge: Data Lives Everywhere
Your POS, inventory system, scheduling software, and compliance tracking all exist separately.
Building a comprehensive restaurant operations report requires accessing multiple platforms.
The solution: Invest in integrated platforms that centralize data.
Some restaurant operations management systems connect multiple data sources. You get complete visibility in one place.
Challenge: Reports Need More Timeliness
Waiting to compile last week's numbers means making decisions based on slightly dated information.
You want access to current insights.
The solution: Move to real-time or near-real-time reporting.
Modern systems pull data continuously. You're always looking at current information.
Challenge: Finding Signal In The Noise
You have lots of numbers. But you want to quickly understand which metrics need attention and which are on track.
The solution: Focus on exception-based reporting.
Set up alerts that flag notable changes automatically. When food costs shift 5% at any location, you get notified immediately.
This helps you focus attention where it creates the most value.
How Modern Platforms Handle Restaurant Reporting
Here's where most multi-unit operators find the biggest opportunity.
You want to track everything. But your team is focused on managing daily operations.
They need systems that work efficiently. They need tools that don't require constant manual updates. They need platforms that make reporting effortless.
The restaurants that make reporting work are using platforms that automate the heavy lifting.
What you need from a restaurant reporting platform:
- Real-time visibility across all locations
- Mobile access so managers can check performance from anywhere
- Automated alerts when metrics shift from targets
- Task execution tied directly to reporting
Most platforms make you choose between operations management and reporting.
You use one tool for restaurant task management. Another for compliance tracking. Something else entirely for analyzing performance.
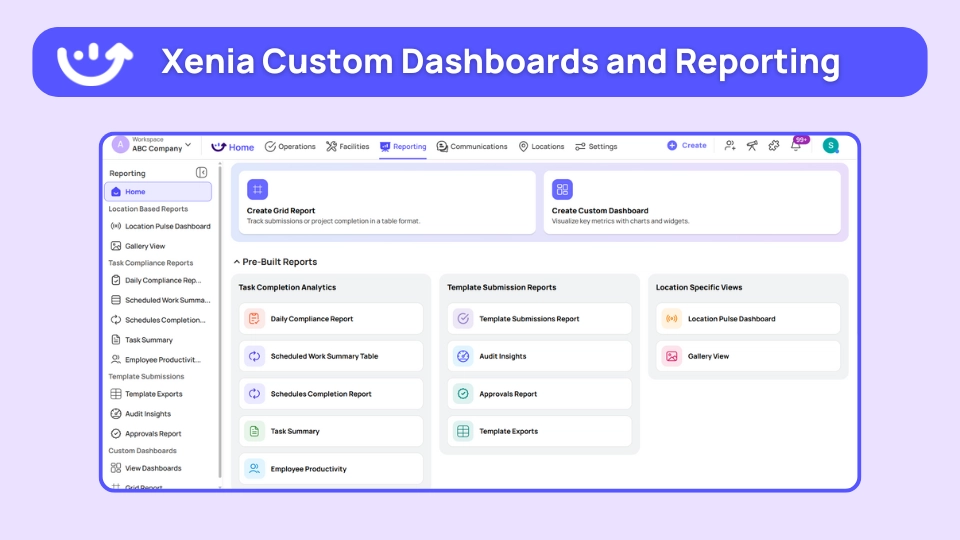
How Xenia Brings It All Together

Xenia takes a different approach.
When your team completes opening checklists, logs food temps, or marks maintenance tasks as done, that data automatically flows into your operational reports.
No manual entry. No separate systems.
Here's what that looks like in practice:
Your downtown location's compliance score changes from 92% to 78% over two weeks. You get an alert the day it happens.
You open Xenia and see exactly which tasks need more attention. Closing checklists show opportunities for improvement.
The AI photo analysis feature shows you that closing managers are taking photos of equipment. The system identifies patterns and suggests areas where teams can improve their protocols.
You call the manager. They explain they've been adjusting to new staffing schedules. They've been prioritizing customer service while building consistency in closing procedures.
Opportunity identified. Solution clear. You adjust staffing for closing shifts and provide additional training support.
That entire process took 10 minutes instead of three weeks.
That's the difference between reactive management and proactive optimization.
Frequently Asked Questions
What is restaurant reporting?
Restaurant reporting means bringing all your key business data into one place so you can understand how your restaurants are actually performing. It pulls information from systems like POS, inventory, scheduling, and compliance tools to give you clear reports on sales, labor costs, food costs, and customer experience, so you can make better decisions, faster.
What are the most important restaurant reports to track?
The most important restaurant reports focus on what directly affects your profits. This includes sales and revenue, labor costs, food and inventory costs, prime costs, overall location performance, compliance, and customer feedback. For multi-location operators, it's best to start by tracking 5–7 key metrics that matter most to the business. Once your team is comfortable using these reports, you can slowly add more as needed.
How do you calculate restaurant performance indicators?
Restaurant performance is measured by tracking key operational metrics and comparing them to industry standards. The Restaurant Performance Index (RPI) usually looks at things like same-store sales growth, customer traffic, average check size, and table turnover. Prime cost, which combines food and labor expenses, should generally stay between 60–65% of total revenue for most restaurant types.
What is the current RPI for restaurants?
The Restaurant Performance Index (RPI) isn't a fixed number, it varies by concept, market, and location. It's a combined score based on sales growth, customer traffic, average check size, and overall efficiency. Each restaurant should set its own RPI targets based on its business model, local market, and growth goals.
How does AI improve restaurant reporting?
AI makes restaurant reporting smarter and easier. It automates data collection, analyzes photos from daily inspections to spot maintenance issues, finds patterns across locations, predicts busy periods and inventory needs, and sends alerts when metrics fall outside targets. With AI, routine tasks like checklists become automatic data points, helping you build full operational reports without manual work.
Final Thoughts
Restaurant reporting is about having the information you need to run better operations and catch opportunities early. The difference between restaurants that thrive and those that struggle often comes down to how well they use data.
Single locations can rely on intuition and daily observation, but multi-unit operations need systems that give visibility across every location. Good reporting turns data into insights, helping you spot trends, optimize proactively, and know exactly where to focus attention.
Start with the basics: track your key metrics and build simple reports your team will actually use. Then expand as your comfort with data grows.
Tools like Xenia make it easy by connecting your operations, automating reporting, and giving you clear insights so you can focus on growing your business.
Frequently Asked Questions
Got a question? Find our FAQs here. If your question hasn't been answered here, contact us.

Looks like there's no data available in our FAQ section at the moment.

A Modern, AI-Powered Platform Built for Restaurant Operations
Xenia brings kitchen operations, food safety, audits, and team communication into one mobile-first platform. Restaurant teams execute daily work consistently, maintain compliance, and resolve issues faster, while leadership gets real-time visibility across all locations.
.webp)
Why Restaurant Operators Choose Xenia:
🤖 AI-Powered Operations, Convert paper logs instantly and verify food presentation and kitchen cleanliness automatically. Get instant answers about food safety trends without building reports.
🍽️ Food Safety & Compliance, Track line checks and temperature logs with automated alerts. Trigger corrective actions when readings exceed safe ranges. Maintain audit-ready records for health inspections.
📊 Multi-Location Control, Monitor food safety compliance and task completion across regions. Benchmark locations to identify training needs. Export reports for operational reviews.
One platform for kitchen operations, food safety, and compliance across all locations.

.webp)
%201%20(1).webp)

.svg)
%201%20(2).webp)