
Your district manager calls at 9 AM: "Sales are down 15% at Store 12. What's going on?"
You open your POS system. Then your scheduling software. Then inventory. Export three CSVs, build pivot tables, and two hours later, you still do not have a clear answer.
That's the problem retail data analytics solves. Instead of drowning in disconnected spreadsheets, you get instant answers to questions that actually matter without needing a data science degree.
This guide explains what retail analytics is, the four types every operations manager should know, and how AI is making sophisticated retail data analysis accessible to frontline teams in 2026.
.webp)
.svg)

Priced on per user or per location basis
Available on iOS, Android and Web


What Is Retail Analytics?
Retail analytics is the process of collecting and analyzing data from sales, inventory, labor, and operations to identify patterns that improve store performance.
Here's the difference between having data and having analytics:
- Just data: Store 47's labor cost is 32% of revenue versus a 28% target.
- Actual retail analytics: Store 47 is overscheduling Tuesday lunch shifts by 2.7 hours because foot traffic dropped after the office building next door went remote. Cut one mid-shift and save $847 monthly.
Same numbers. Completely different value.
The best retail data analytics systems don't just show what happened; they explain why it happened and what to do about it. That's the difference between a dashboard and a decision engine.
Most multi-location retailers have plenty of retail data. What they are missing is the insight layer that turns information into action.
The 4 Types of Retail Data Analytics
Every analytics platform talks about insights, but most only deliver one type. Here's the framework that separates useful retail analytics from expensive dashboards nobody uses:
1. Descriptive Analytics: What Happened?
This is baseline retail store analytics. Sales totals. Transaction counts. Inventory levels. Shrink percentages.
- Example: Q4 same-store sales grew 6.2% versus last year.
- Business value: You know if you hit targets and can track performance trends.
- Limitation: Zero context. Sales are up, but you don't know if it's your promotion,the weather, or competitors closing locations.
Most retailers stop here. That's why problems always feel like surprises.
2. Diagnostic Analytics: Why Did It Happen?
Diagnostic analytics answers "why" by connecting retail data across systems, sales, weather, promotions plus staffing patterns.
- Example: Q4 sales spiked because your November BOGO promotion drove 34% higher basket sizes in stores with extended weekend hours. Stores without those hours saw flat sales despite running the same deal.
- Business value: You stop guessing and know exactly which operational changes actually worked.
- Limitation: It's backward-looking. By the time you diagnose last month's problem, you have already lost this month's opportunity.
This is where most business analytics in retail platforms operate. Great post-mortems, but you are still managing through the rearview mirror.
3. Predictive Analytics: What Will Happen?
Predictive analytics uses historical patterns and external signals to forecast future outcomes. Demand predictions. Shrink risk scores. Staffing requirements.
- Example: Your system flags that Store 22 will run out of your top SKU by Thursday based on current sell-through rates and delayed shipments.
- Business value: You shift from reactive to proactive operations. Redistribute inventory Tuesday morning instead of scrambling Thursday afternoon when shelves are empty.
- Limitation: Predictions are probabilities, not certainties. If your retail datasets are incomplete or dirty, you get confident forecasts that are confidently wrong.
This is where retail big data analytics starts delivering serious ROI, but only with clean, integrated data feeding the models.
4. Prescriptive Analytics: What Should We Do?
Prescriptive analytics recommends specific actions ranked by business impact, the frontier of analytics in retail.
- Example: "Store 22 will stock out Thursday.
Option 1: Transfer 48 units from Store 18 (saves $320 in lost sales, costs $45 in labor). Option 2: Expedite from distribution (saves $320, costs $89).
Recommended: Option 1."
- Business value: Decision-making becomes execution. Your managers stop debating what to do and start doing it.
- Limitation: Requires sophisticated AI, clean data integration across all systems, and organizational trust in automated recommendations.
What matters most in 2026? Diagnostic analytics with natural language capabilities. The ability to ask "Why did shrink spike at Store 9?" and get an answer in 8 seconds, not 8 hours of manual retail data analysis.
How Can Data Analytics Be Used in Retail?
Here's what good retail analytics actually does when implemented correctly:
Reduces Shrink and Food Waste Through Pattern Detection
Shrink isn't random. It clusters around specific products, locations, times, and operational gaps. But most retailers only see totals "2.1% shrink", which provides nothing actionable.
Data analytics for retail connects the dots:
- Produce shrink spikes every Sunday night at stores where Monday delivery runs late
- High-theft SKUs move through self-checkout 3.2x more than staffed lanes
- Refrigeration failures cause 18% of total shrinkage, but only get flagged after food spoils
With diagnostic retail business analysis, you stop treating shrink as an unavoidable cost and start treating it as a solvable process problem. Adjust delivery schedules, reposition high-risk inventory, and deploy predictive maintenance before product spoils.
The same pattern detection applies to food waste. Analytics identifies which items consistently expire before sale, which prep procedures generate excessive waste, and which stores need portion control retraining.
Optimizes Labor Scheduling Based on Actual Demand
Most retailers schedule the same way they did 20 years ago: "Tuesday needs 47 hours based on last year's sales." That’s descriptive analytics being passed off as planning; it tells you what already happened, not what to do next.
Modern data analytics in retail layers in:
- Real-time traffic patterns: Foot traffic drops 34% after 8 PM on weeknights, but current schedules keep full staff until 9 PM
- Task-based workload modeling: High inventory turnover weeks require 22% more stocking hours, but schedules don't flex
- Performance correlation: Stores maintaining 1 employee per 12 customers see 9% higher conversion than understaffed locations
The result is not just cost savings, it's a better customer experience because you are staffed when shoppers actually need help.
Improves Store Layout and Product Placement Decisions
Where you place products determines how much you sell. Retail in-store analytics quantifies what works:
- Dwell time heat maps show customers spend 40% longer in sections with clear sightlines
- Basket analysis reveals customers who buy Product A are 5.7x more likely to buy Product B, but only if B is within 8 feet of A
- Seasonal placement testing shows end-cap promotions drive 23% higher lift for impulse categories versus integrated shelf placement
Instead of copying corporate planograms or guessing based on intuition, you are testing and measuring based on actual shopper behavior in your specific stores.
Enables Faster Response to Market Changes
When competitors open, supply chains disrupt, or customer preferences shift, speed matters. Retail analytics data compresses your detection-to-action cycle.
Without analytics: You notice declining sales three weeks later during the monthly review. By the time you investigate root causes and adjust strategy, you have lost six weeks of revenue.
With analytics: AI flags the sales dip within 48 hours, correlates it to the new competitor location, and surfaces specific categories where you are losing share. You adjust pricing and promotions the same week.
The value is not perfection, it's agility through faster, smaller corrections instead of big, late overcorrections.
Retail Analytics Best Practices for 2026
Getting value from retail data analytics is not about buying the most expensive platform. It's about implementation and usage patterns.
Start with One High-Impact Use Case
Retailers that try to build comprehensive analytics programs across all functions simultaneously fail. Too much scope, too many stakeholders, too many dependencies.
Instead, pick one painful problem where better data would directly drive decisions:
- Reducing shrinkage in high-loss categories
- Optimizing labor scheduling at underperforming stores
- Improving compliance with food safety protocols
Solve that one problem well. Prove ROI. Then expand to adjacent use cases. Success builds momentum.
Prioritize Data Quality Over Data Quantity
More data does not equal better insights. Garbage in, garbage out remains the iron law of analytics.
Before building dashboards, audit your foundational data:
- Are POS transactions reconciled daily with actual cash and inventory?
- Do labor systems accurately capture clock-in/clock-out times, or are managers manually adjusting timecards?
- Are safety and maintenance logs filled out completely, or are teams skipping fields to save time?
If source data is unreliable, every analysis built on top is suspect. Fix inputs before optimizing outputs.
Train Frontline Managers on Analytics Thinking
The best analytics platform fails if managers do not know how to ask good questions or interpret results.
Most training focuses on "how to use the dashboard." That's necessary but insufficient. Also teach:
- Correlation versus causation: Sales dropped after you ran a promotion, but that does not mean the promotion caused the drop
- Statistical significance: Store 8's shrink went from 2.1% to 2.4%, but that might just be normal variance, not a trend
- Leading versus lagging indicators: Customer complaints spike before negative reviews appear publicly
Analytical literacy is a skill. Invest in building it across frontline leadership, not just your HQ analytics team.
The 2026 Shift: Natural Language Queries Transform Retail Data Analysis
Here's what's fundamentally changing in data analytics in the retail industry: the barrier between "I have a question" and "I have an answer" is collapsing.
Traditional BI tools required you to know which report to open, which filters to apply, which date ranges to select, and how to interpret output. That works if you are a data analyst. It fails if you are a district manager with 47 other priorities.
Natural language queries flip the model entirely. Instead of navigating complex dashboards, you just ask:
- "Which stores are overscheduling lunch shifts?"
- "Show me shrink trends for dairy across the Southeast region."
- "Why did customer count drop 12% at Store 18 last Tuesday?"
Your retail data analytics platform interprets the question, pulls relevant data, runs the analysis, and surfaces the answer, often with visual context and recommended actions.
This is not theoretical. AI platforms are already powering retail analytics solutions that let non-technical users interrogate complex datasets as if they were texting a coworker.
Smart Highlights: AI Surfaces Anomalies Before You Ask
The next layer is proactive insights. Instead of waiting for you to ask the right question, AI continuously scans your retail analytics data and flags anomalies worth investigating.
Example smart highlights:
- Store 31's average transaction value dropped 18% since Tuesday, driven entirely by a pricing error on your best-selling SKU
- Three Midwest locations are experiencing 2.4x normal dairy shrink this week, which correlates with refrigeration sensor malfunctions flagged in maintenance logs
- Weekend closing shifts at urban stores are consistently understaffed by one person compared to actual customer traffic patterns
These are not scheduled reports. They are dynamic alerts generated when AI detects patterns deviating from baseline expectations.
Your managers stop spending 60% of their time hunting for problems and spend it solving them instead.
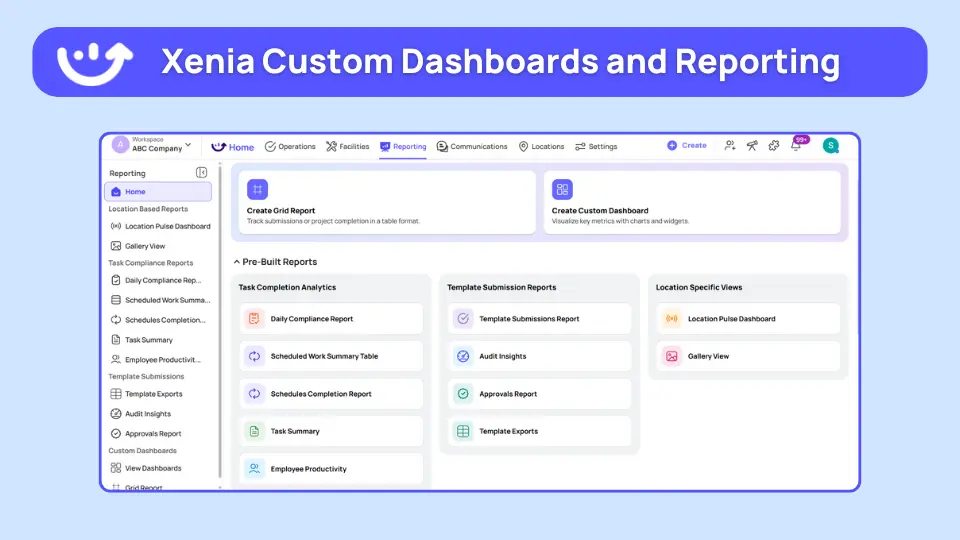
How Xenia Supports Retail Data Analytics
Most retail analytics platforms are built for data analysts, not operators. Xenia's Reporting & Analytics is designed for district managers and store leaders who need instant operational visibility without technical complexity.
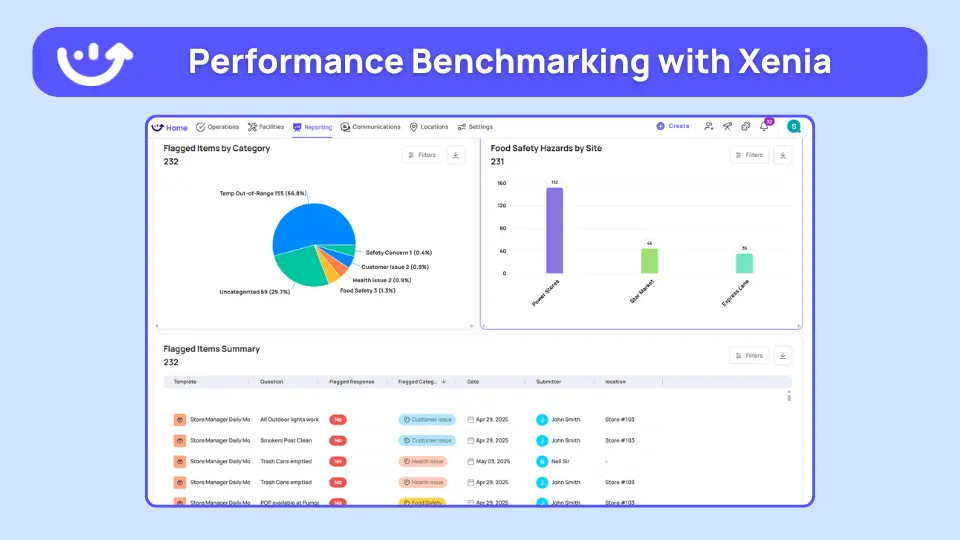
Real-time dashboards with role-based views. Xenia shows the metrics that matter for your role, store managers see today's performance and flagged issues, and district managers compare locations with drill-down capability. Mobile-first design means you access insights from the sales floor, not the back office.
AI-powered smart highlights. Instead of manually hunting through reports, Xenia's AI flags patterns worth investigating. Get proactive alerts when metrics deviate, like shrink spikes correlated with operational gaps or compliance drops at specific locations.
Integrations that connect disconnected data. Xenia integrates with HRIS, POS, and inventory systems like Workday, ADP, Square, and Toast. Correlate labor hours with sales performance. Link inventory data with task completion to diagnose shrink drivers. Stop exporting CSVs to connect dots across systems.
Custom reports without IT dependency. Build reports using drag-and-drop interfaces, no coding required. Create views for your specific questions: stores ranked by compliance, task completion trends, or maintenance correlated with downtime. Reports update automatically as new data flows in.
FAQs
What is retail analytics, and how can it be used to reduce food waste and shrink?
Retail analytics is the process of analyzing sales, inventory, and operational data to improve store performance. It helps retailers understand not just what's happening but why.
To reduce food waste and shrink, analytics platforms track expiration dates. They connect spoilage to refrigeration problems. They flag high-theft SKUs and reveal process gaps such as missed closing checklists.
Instead of only reporting totals, analytics identifies root causes. This approach typically helps retailers reduce shrinkage by 15–30%.
What is the best retail dashboard for analytics that non-technical managers can use?
The best retail dashboards for non-technical users are simple and easy to act on. They combine real-time data with role-based views and mobile access.
Strong dashboards also use AI to spot issues early. Features like natural language queries let users ask questions instead of building reports. Proactive alerts flag problems automatically and connect with POS, labor, and inventory systems.
Tools like Xenia's Reporting & Analytics are built for frontline operators, not data analysts.
How can data analytics improve retail store layout and shopper dwell time?
Retail analytics helps improve store layout by showing how customers move and shop in your stores. It turns behavior into clear, actionable insights.
Retailers use heat maps to track customer movement. They measure how long shoppers stay in each section. Basket analysis shows which products are often bought together.
Teams can also A/B test different layouts to see which ones drive more sales. By understanding traffic flow and product placement, retailers can increase dwell time in high-margin areas and improve cross-sell opportunities.
Conclusion
Retail analytics in 2026 is no longer about dashboards and reports. It’s about getting clear answers fast and turning insight into action at the store level. The retailers that win are not the ones with the most data but the ones that can explain why something is happening and what to do next before small issues become expensive problems.
As AI, natural language queries, and real-time integrations become standard, analytics is shifting out of the back office and onto the sales floor. District managers and store leaders do not need to think like data analysts. They need tools that surface issues automatically and guide better decisions in the moment.
That’s where platforms like Xenia fit naturally. By combining operational data, task execution, and AI-powered insights in one system, Xenia helps teams move from spreadsheets to instant, actionable visibility, without complexity.
In a retail environment where speed and execution matter most, analytics only creates value when it’s built for the people actually running the stores.
Frequently Asked Questions
Got a question? Find our FAQs here. If your question hasn't been answered here, contact us.

Looks like there's no data available in our FAQ section at the moment.

A Modern, AI-Powered Platform Built for Retail Operations
Xenia brings store operations, merchandising, audits, and loss prevention into one mobile-first platform. Store teams execute daily work consistently, maintain brand standards, and resolve issues faster, while regional and corporate leadership get real-time visibility across all locations.
Why Retail Operators Choose Xenia:
🤖 AI-Powered Merchandising, Verify planograms, displays, and brand standards automatically with AI photo analysis. Build digital checklists instantly or convert existing merchandising guides.
🏬 Operations & Loss Prevention, Assign opening procedures, store walks, and resets across locations. Track theft, cash discrepancies, and security incidents with evidence and approval workflows.
📊 Real-Time Visibility, Compare audit scores and task completion across stores. Identify top and underperforming locations. Export reports for leadership reviews.
One platform for operations, merchandising compliance, and loss prevention across all locations.

.webp)
%201%20(1).webp)

.svg)
%201%20(2).webp)