
.webp)
Post Summary
One store kills it every month. Another one keeps missing targets. You know something is wrong. But to figure out what, you are pulling exports from five different tools just to get started.
That is the problem. The data is there. You just cannot see it fast enough.
Retail analytics software fixes that. It pulls your sales numbers, operations data, compliance scores, and store traffic into one place your team can actually use. No more chasing reports. No more guessing.
This guide covers two things. First, how to pick the right type of tool for your operation. Second, straight reviews of 8 tools worth looking at in 2026, including what each one does well and where it falls short.
Types of retail analytics you need to know
Not every retail analytics tool covers the same thing. Before you look at any software, get clear on what kind of data you actually need.
**
Type, What it tracks, Who needs it
Sales analytics, Revenue-transactions-basket size-product performance, Every retail operator
Inventory analytics, Stock levels-shrinkage-turnover-reorder timing, Operators with complex inventory
Operations and compliance analytics, Task completion-audit scores-brand standards by location, Multi-location operators
Foot traffic analytics, Store visits-peak hours-conversion rates-time spent, Operators optimizing staffing and layout
**
Most multi-location operators need both sales data and operations data. The right tool depends on which one you are missing right now.
How to buy retail analytics software for multiple locations
What should retail analytics software actually do?
5 things matter when you are evaluating tools for a multi-location setup.
1. See all locations in one place. You need a single view that shows every store, with the ability to click into any one of them. If the tool only shows one location at a time, you end up logging into each store separately and rebuilding the same comparison by hand every week. That is not analytics. That is data entry with extra steps.
2. Show you data fast. Retail moves quickly. If your reports update once a day, that is fine for planning. But it is too slow for catching a real problem before it costs you money. Look for a tool that refreshes in near real time, ideally every few minutes, so a stockout or a sudden sales drop shows up while you can still act on it, not the next morning.
3. Push problems to you. The best tools do not wait for you to log in and find an issue. They send you an alert when something drops below where it should be.
4. Work with your other tools. Your analytics should connect to your POS, inventory system, and operations software. A tool that sits on its own only gives you part of the story.
5. Match your org structure. Store managers should see their store. District managers should see their region. Corporate should see everything. Make sure the tool can do that.
How is buying retail analytics different when you run multiple locations?
Single-store operators can use simpler tools. If you run multiple locations, the bar is higher.
Start with location comparison. Can you rank stores by performance? Can you filter by region? Can you flag which stores are falling below a set standard? If that is hard to do, you will spend your time building reports instead of fixing problems.
Next, know the difference between sales tools and operations tools. Most BI platforms like Domo, Looker, and Power BI answer money questions. They cannot tell you if your team finished the opening checklist or whether your brand standards compliance audit scores are dropping. That requires a different kind of tool.
Also look at AI-powered retail analytics platforms. They can find patterns in your data that would take your team hours to spot. If you want a broader look at where AI fits in retail, this guide to AI-powered retail is worth a read.
7 best retail analytics software tools in 2026
.svg)
.webp)

**
Tool, What it focuses on, Multi-location, AI, Best for
Xenia, Operations and compliance analytics, Built-in, AI Photo Analysis, Multi-unit ops and compliance
Domo, BI and sales analytics, Yes, AI insights, Analytics teams with data engineers
Looker, BI and sales analytics, Yes, AI via Gemini, Developer-led analytics orgs
Power BI, BI and sales analytics, Yes, Copilot AI, Microsoft-stack businesses
Placer.ai, Foot traffic analytics, Yes, AI predictions, Site selection and traffic analysis
Lightspeed Analytics, POS-native analytics, Yes, Limited, SMB retailers on Lightspeed POS
Datawiz BI, Retail-specific BI, Yes, Limited, Grocery and convenience chains
**
1. Xenia
- Best for: Multi-location retail operators who need to see operations and compliance data across every store, not just sales numbers
- Not for: Replacing your POS reporting or a full BI data warehouse
Xenia is an operations execution platform built for retail. It is rated 4.9/5 on Capterra. Where POS systems and BI platforms stop, Xenia picks up. This retail analytics software gives you operations and compliance visibility across all your locations in one place.
.webp)
Xenia's Analytical Agent stands out here. Ask it a plain-language question, like which stores are trending below target this week, and it pulls the answer straight from your operations data instead of making you build a report from scratch. Xenia's AI-Powered Summaries take it further. Rather than scrolling through every store's dashboard, you get a written breakdown of what changed, where, and why it matters, so you spend your time fixing the issue instead of digging for it.
The multi-location operations dashboard shows you task completion rates, audit scores, corrective action status, and live performance across all stores at once. Drill into any location. Compare regions. Get alerts when a store drops below your standard. Xenia's frontline reporting gives you all of this without needing an analyst.
Xenia connects with Workday, ADP, UKG, and 7shifts for HR data. It runs alongside your POS and inventory tools as your operations and compliance layer. It does not replace them. For a clear picture of how retail execution works across a multi-unit portfolio, that article breaks it down well.
Key features:
- Multi-location compliance dashboards with store-by-store comparison
- Live task completion tracking across all locations
- Analytical Agent for plain-language data queries across your operations
- AI-Powered Summaries that surface what changed and why, store by store
- Custom dashboards built around the metrics each role actually needs
- PDF and CSV export for sharing reports outside the platform
- HR system integrations with Workday, ADP, UKG, and 7shifts
- Role-based access by store, region, and corporate via location hierarchy and permissions
Pricing: Get a quote for your operation.

Priced on per user or per location basis
Available on iOS, Android and Web


2. Domo

- Best for: Retail companies with in-house analyst teams who need a full BI and data visualization platform
- Not for: Operators who need something up and running fast without a data engineering team
Domo is a cloud-based BI tool with strong visuals and a large library of data connectors. It can pull in sales data, inventory data, and operational metrics from hundreds of sources and put them into custom dashboards. If you have analysts who can build and manage Domo environments, it is a capable platform.
The honest gap is this. Domo needs significant setup to work well. It assumes your data is already structured and that someone on your team can build the reports you need. It does not track brand standards execution, daily checklists, or store-level compliance out of the box. For most multi-unit operators, Domo handles the financial and sales side. You will still need a separate tool for operations questions.
Key features:
- 500+ prebuilt connectors including POS, inventory, and e-commerce platforms
- Drag-and-drop dashboard builder
- AI-driven anomaly detection and business insights
- Real-time data refresh with alert triggers
- Multi-location filtering and comparison views
- Mobile dashboard access
Pricing: Enterprise pricing based on users and data volume. Contact Domo for a quote.
3. Looker (Google)
.webp)
- Best for: Data-mature retail organizations already on Google Cloud or BigQuery
- Not for: Teams without data engineers or BI developers on staff
Looker is a developer-first BI platform that is now part of Google Cloud. It uses a modeling language called LookML. That lets data teams define your key metrics once and keep them consistent across every report and dashboard in the business. For retail companies with strong data infrastructure, Looker brings consistency and control.
The gap is the same one Domo has. Looker is not something your store managers or district managers will open every morning. It is a tool for analysts and developers. Without the technical resources to run a LookML environment, you will not get the value out of it. For compliance and audit tracking, you will need something built differently.
Key features:
- LookML modeling for consistent metric definitions across all reports
- Native Google Cloud and BigQuery integration
- AI-powered data exploration via Gemini
- Embedded analytics for custom internal apps
- Multi-location retail dashboards with drill-down
- Scheduled reports and alert triggers
Pricing: Contact Google Cloud for current Looker pricing.
4. Power BI (Microsoft)
.webp)
- Best for: Retail organizations running on Microsoft 365, Azure, and Dynamics
- Not for: Teams outside the Microsoft ecosystem or operators who need frontline mobile access
Power BI is Microsoft's BI tool. If your business already runs on Microsoft 365, Azure, and Dynamics, it fits naturally into your stack. The Copilot AI feature lets users ask plain-language questions and get charts and summaries back. For financial and sales reporting across multiple store locations, Power BI does the job well.
The gap is clear. Power BI is a reporting tool, not an operations platform. It does not run audits, track checklist completion, handle corrective actions, or check brand standards. The mobile experience is aimed at analysts, not frontline workers. If you need both sales and operations data, Power BI plus an operations platform is the typical setup.
Key features:
- Native Microsoft 365 and Azure integration
- Copilot AI for plain-language data queries
- Custom dashboards with 200+ data connectors
- Multi-location reports with region filtering
- Automated data refresh and scheduled report delivery
- Embedded analytics for internal tools
Pricing: Power BI Pro starts around $10 per user per month. Premium plans cost more.
5. Placer.ai
.webp)
- Best for: Retail operators who need foot traffic data, site selection support, and competitive benchmarking
- Not for: Operations teams that need store execution or compliance tracking
Placer.ai uses anonymized mobile location data to show you foot traffic patterns, competitor visits, and trade area demographics. If you are deciding where to open a new location, figuring out which stores are winning on traffic, or comparing yourself to competitors nearby, Placer.ai gives you data you would otherwise have to pay a lot to research.
The gap is simple. Placer.ai tracks what happens outside your store, not inside it. It cannot tell you how your team is executing daily operations or whether your retail operations execution standards are being met. It answers location strategy questions. Most operators use it alongside an operations platform, not instead of one.
Key features:
- Foot traffic data from anonymized mobile location signals
- Competitor visit analysis and trade area benchmarking
- Seasonal and daypart traffic patterns by store
- Site selection data for new location decisions
- Portfolio analytics across all locations
- API integration with other BI tools
Pricing: Contact Placer.ai for current pricing based on your portfolio size.
6. Lightspeed Analytics

- Best for: Small and mid-size retailers already running Lightspeed POS who want built-in analytics without a separate tool
- Not for: Enterprise retailers or anyone not on Lightspeed POS
Lightspeed Analytics is the built-in reporting layer inside the Lightspeed POS platform. If you already run Lightspeed across your stores, the analytics module adds sales reporting, inventory insights, and basic multi-location comparison without any extra setup.
The gap is that this only works if you are on Lightspeed. It is also a sales and inventory tool, not an operations compliance platform. If you have outgrown what Lightspeed's native reports can show you, you will need either a standalone BI tool or an operations execution layer to fill the gaps.
Key features:
- Native Lightspeed POS data integration
- Sales reports by location, category, and time period
- Inventory analytics with sell-through and shrinkage tracking
- Multi-location comparison dashboards
- Employee sales performance reports
- Scheduled report delivery
Pricing: Included in Lightspeed POS plans or available as an add-on. Contact Lightspeed for details.
7. Datawiz BI
.webp)
- Best for: Grocery, convenience store, and pharmacy chains that need retail-specific BI with category management built in
- Not for: Specialty retail, apparel, or operators outside grocery and convenience
Datawiz BI is a retail analytics platform built specifically for grocery, convenience, and pharmacy chains. It covers sales, category performance, supplier reporting, and promotion tracking. If general-purpose BI tools feel too generic for your vertical, Datawiz comes with retail-specific metrics and reports already set up.
The gap is that it is built for specific verticals. If you run apparel, home goods, or anything outside grocery and convenience, the platform may not map well to how your categories work. It also does not cover operations execution or compliance. If you run convenience stores, the convenience store operations software page shows what an operations layer on top of your BI tool could look like.
Key features:
- SKU-level sales analytics built for retail
- Category management and assortment reporting
- Supplier performance and promotion ROI tracking
- Multi-location dashboards with region and store filters
- Inventory analytics with turnover and out-of-stock tracking
- API integrations with ERP and POS systems
Pricing: Contact Datawiz for pricing based on store count and data volume.
Conclusion
Pick the tool that answers the questions you actually need answered. For sales and financial reporting, a BI platform like Domo, Looker, or Power BI gets the job done with the right analyst support. For foot traffic and site decisions, Placer.ai is the clear pick. For execution visibility across every location, Xenia fills the gap that none of the sales tools can.
See how Xenia fits as a retail analytics software woven into retail operations to figure out where it fits in your stack.
Frequently Asked Questions
Got a question? Find our FAQs here. If your question hasn't been answered here, contact us.
What should I look for in retail business intelligence software?

Four things. All your locations in one view. Data that updates fast. Role-based access that matches your org structure. And integrations with your POS and inventory tools. For the operations side, add audit scoring, corrective action tracking, and photo-based compliance checks. The retail audit guide walks through what good looks like.
What retail analytics tools work best for multi-location operators?
You need two tools working together. A BI platform like Power BI, Domo, or Lightspeed for sales and revenue data. And an operations execution platform like Xenia for compliance, task completion, and audit scores. They answer different questions. They work best side by side.
How does AI improve retail analytics?
It spots problems before you do. A store trending toward a compliance failure. A reorder needed before you run out. A task completion drop before it hits sales. AI-powered retail analytics platforms can also check brand standards from inspection photos automatically. Xenia's AI photo rollouts feature does exactly this.
What is the difference between retail analytics software and retail BI software?
BI software handles sales and financial data. It needs analysts to build the reports. Retail analytics is broader. It also includes operations execution platforms like Xenia that track task completion, audit scores, and compliance at the store level. Most multi-location operators need both.
What is retail analytics software?
It pulls data from your POS, inventory, and operations tools into one dashboard. Instead of opening five different reports, you see everything in one place and act on it fast.


A Modern, AI-Powered Platform Built for Retail Operations
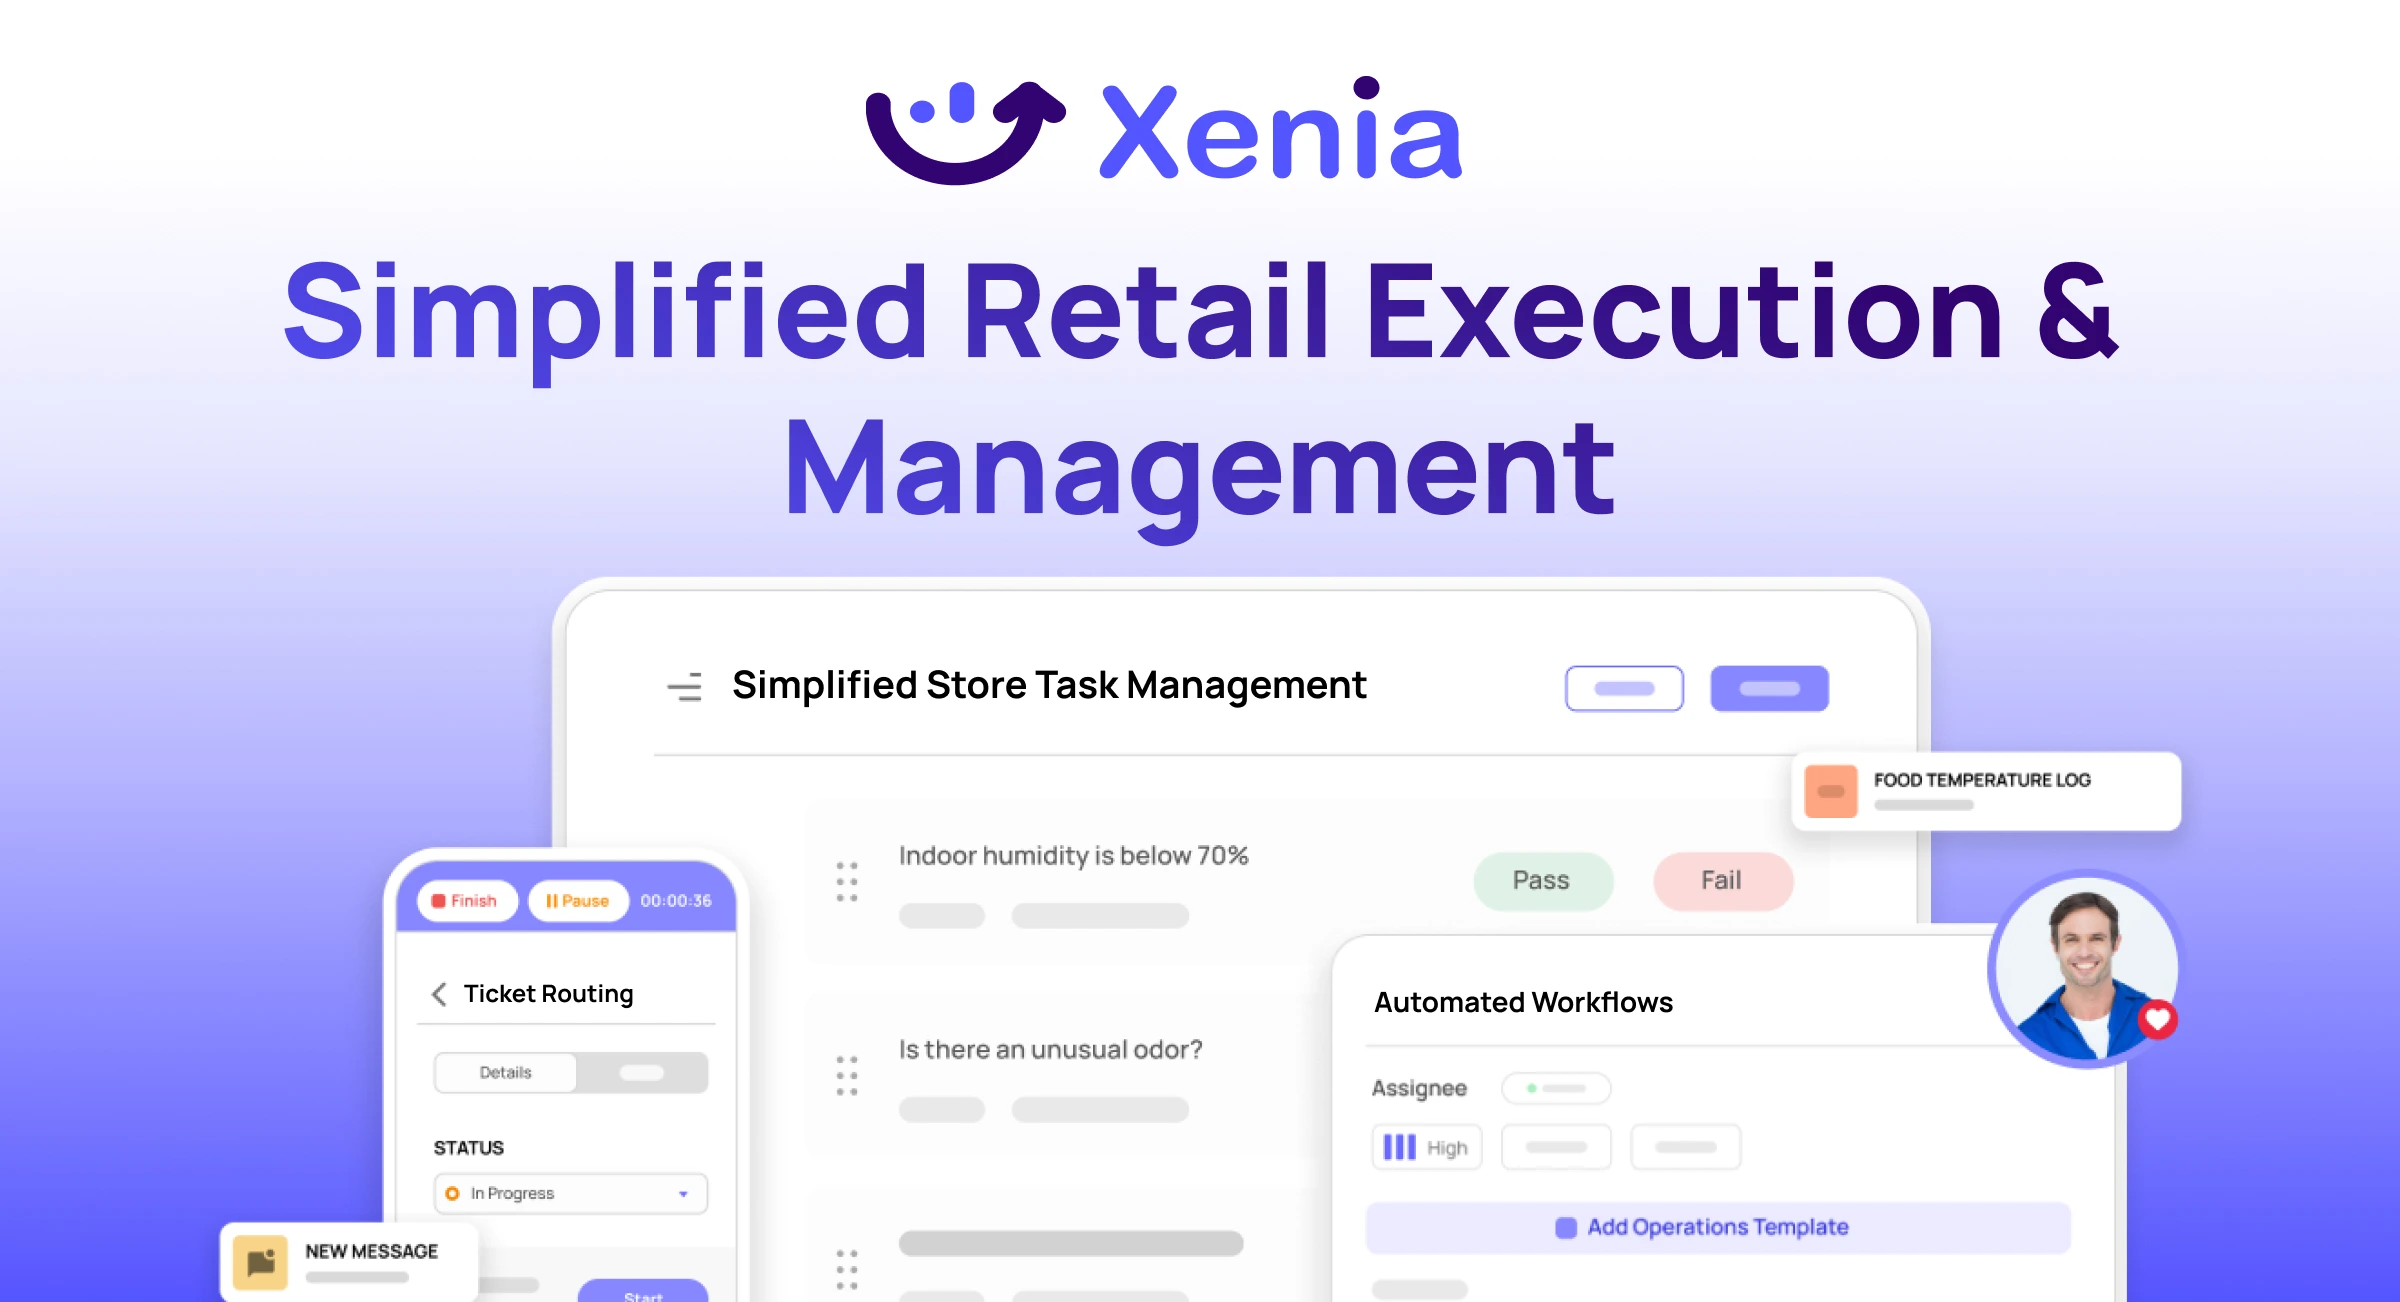
Xenia brings store operations, merchandising, audits, and loss prevention into one mobile-first platform. Store teams execute daily work consistently, maintain brand standards, and resolve issues faster, while regional and corporate leadership get real-time visibility across all locations.
Why Retail Operators Choose Xenia:
🤖 AI-Powered Merchandising, Verify planograms, displays, and brand standards automatically with AI photo analysis. Build digital checklists instantly or convert existing merchandising guides.
🏬 Operations & Loss Prevention, Assign opening procedures, store walks, and resets across locations. Track theft, cash discrepancies, and security incidents with evidence and approval workflows.
📊 Real-Time Visibility, Compare audit scores and task completion across stores. Identify top and underperforming locations. Export reports for leadership reviews.
One platform for operations, merchandising compliance, and loss prevention across all locations.

.svg)
.webp)
%201%20(1).webp)

.svg)
%201%20(2).webp)