
AI-Powered Summaries: Understand Operations at a Glance
.avif)


.webp)
.webp)
.webp)


.webp)


Critical Operational Insights Delivered in Seconds
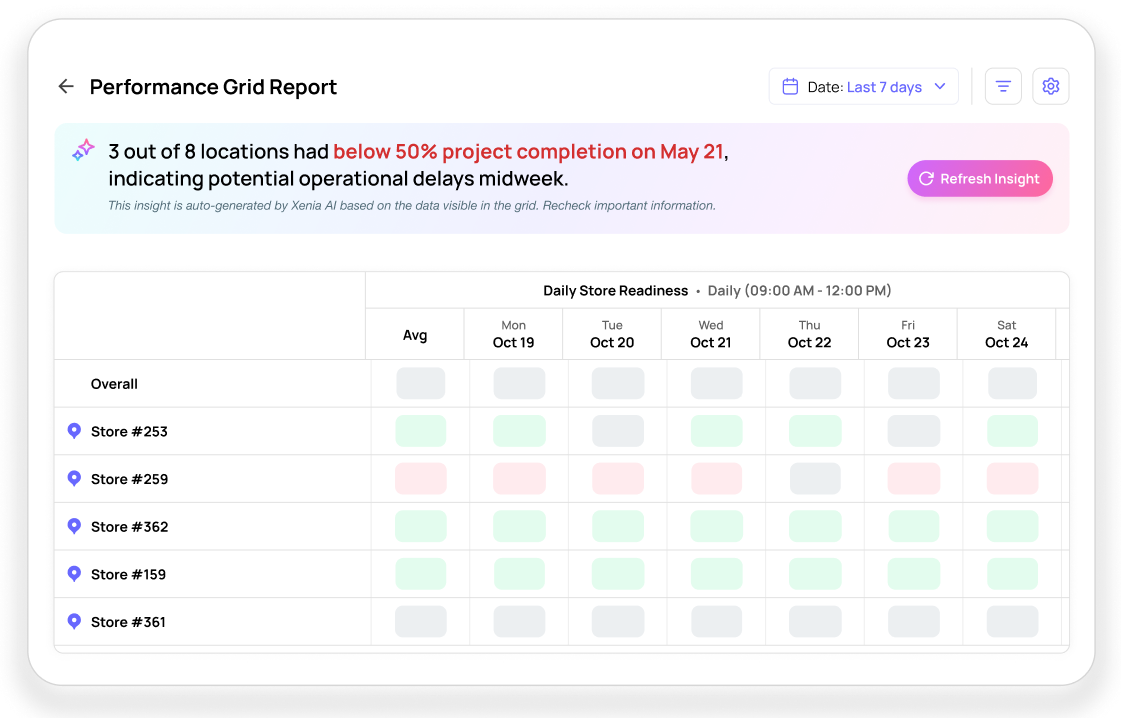
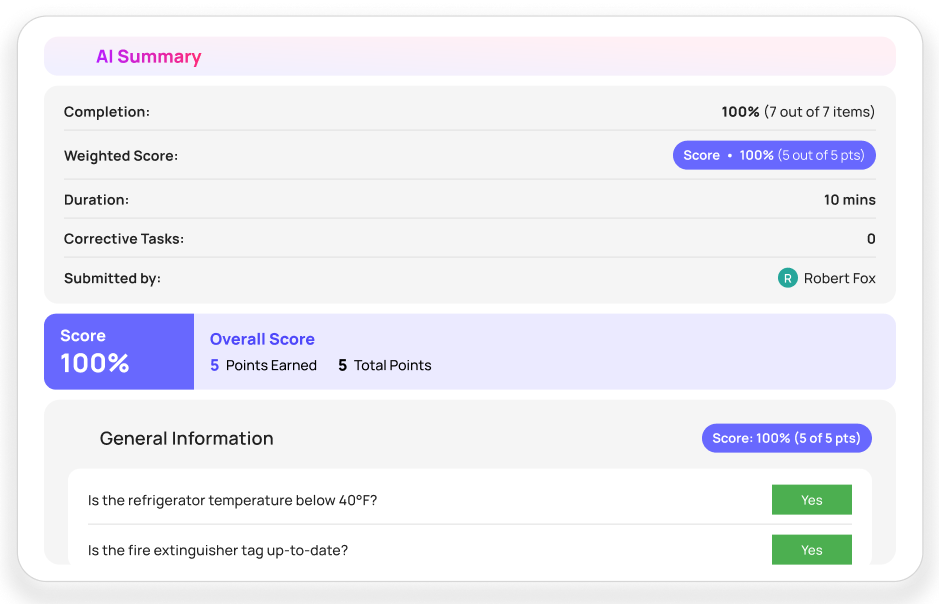
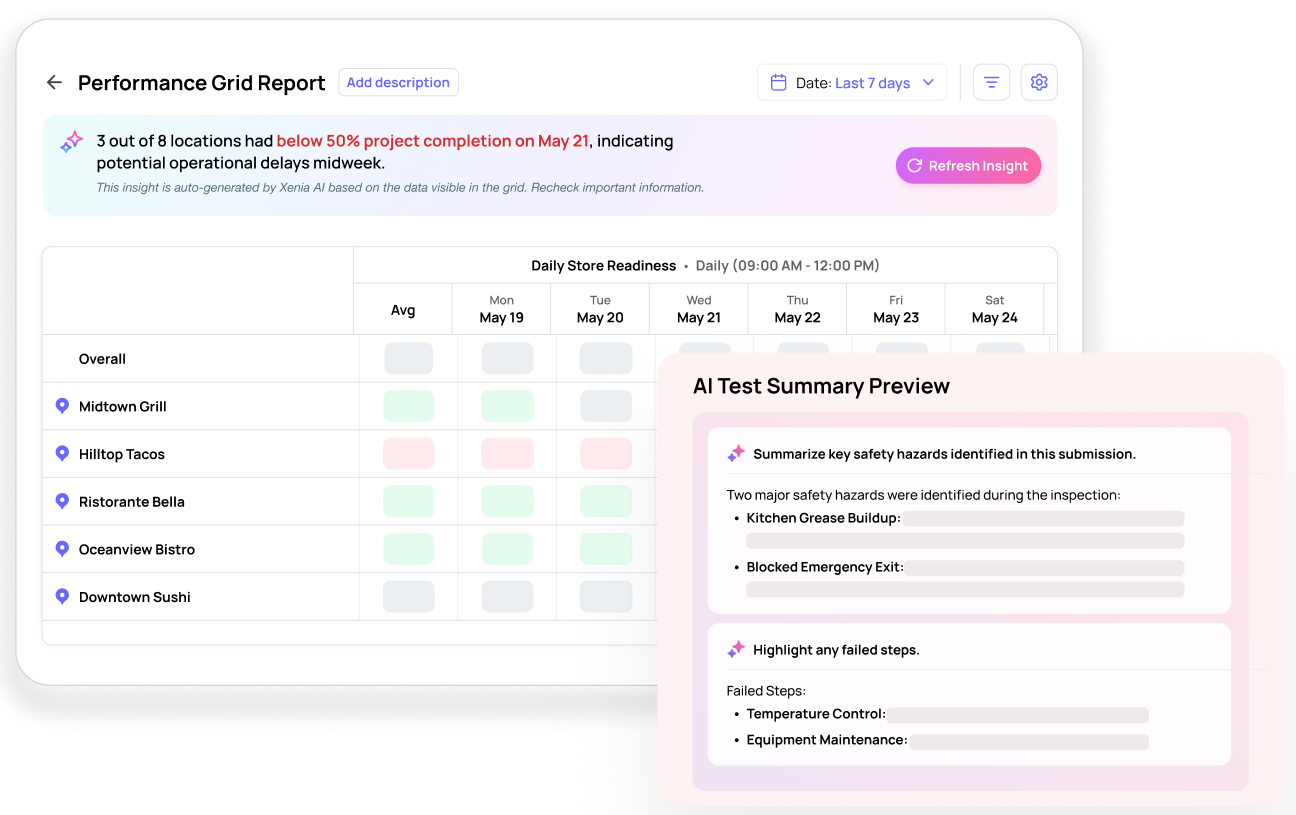
Real-Time Performance Reports
See which locations are doing well and which need help. AI reviews task completion, audit scores, failed items, and compliance gaps. It then shows you the most urgent issues first.
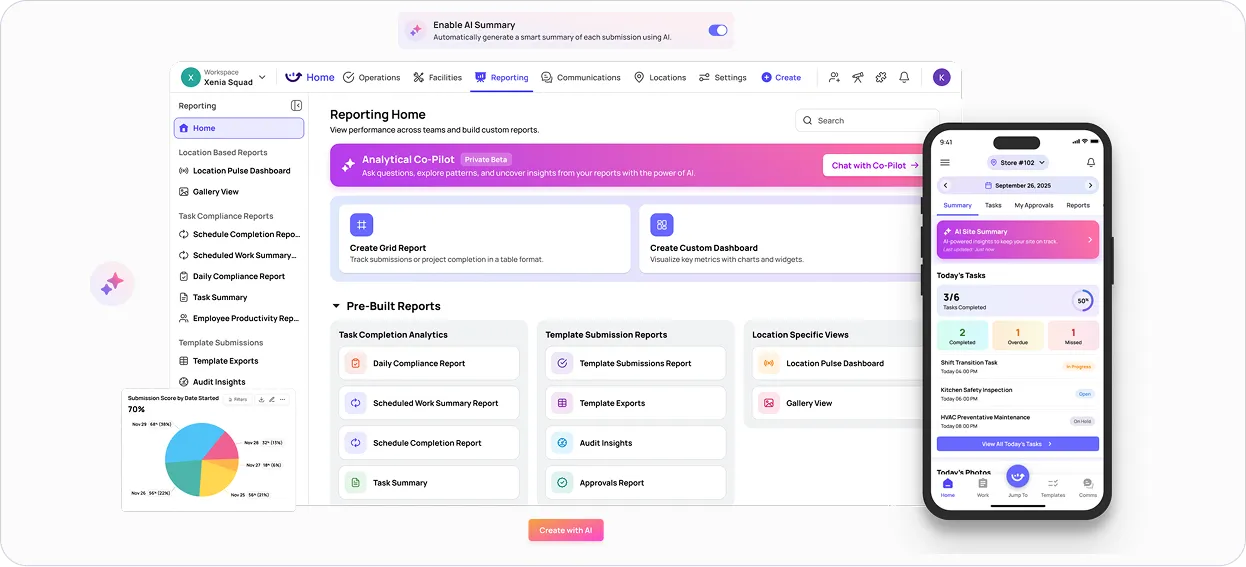
Automated Executive Dashboards
Replace manual reporting with AI-generated daily or weekly executive dashboards that highlight key metrics in one central location.
Proactive Problem Prevention
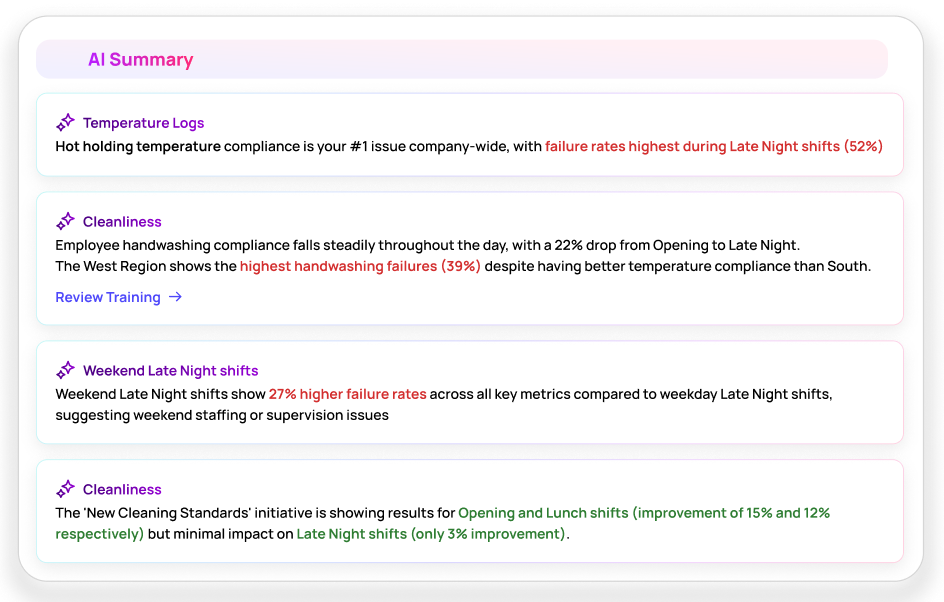
AI identifies patterns that predict future problems. It spots early warning signs and recommends specific interventions before issues escalate.
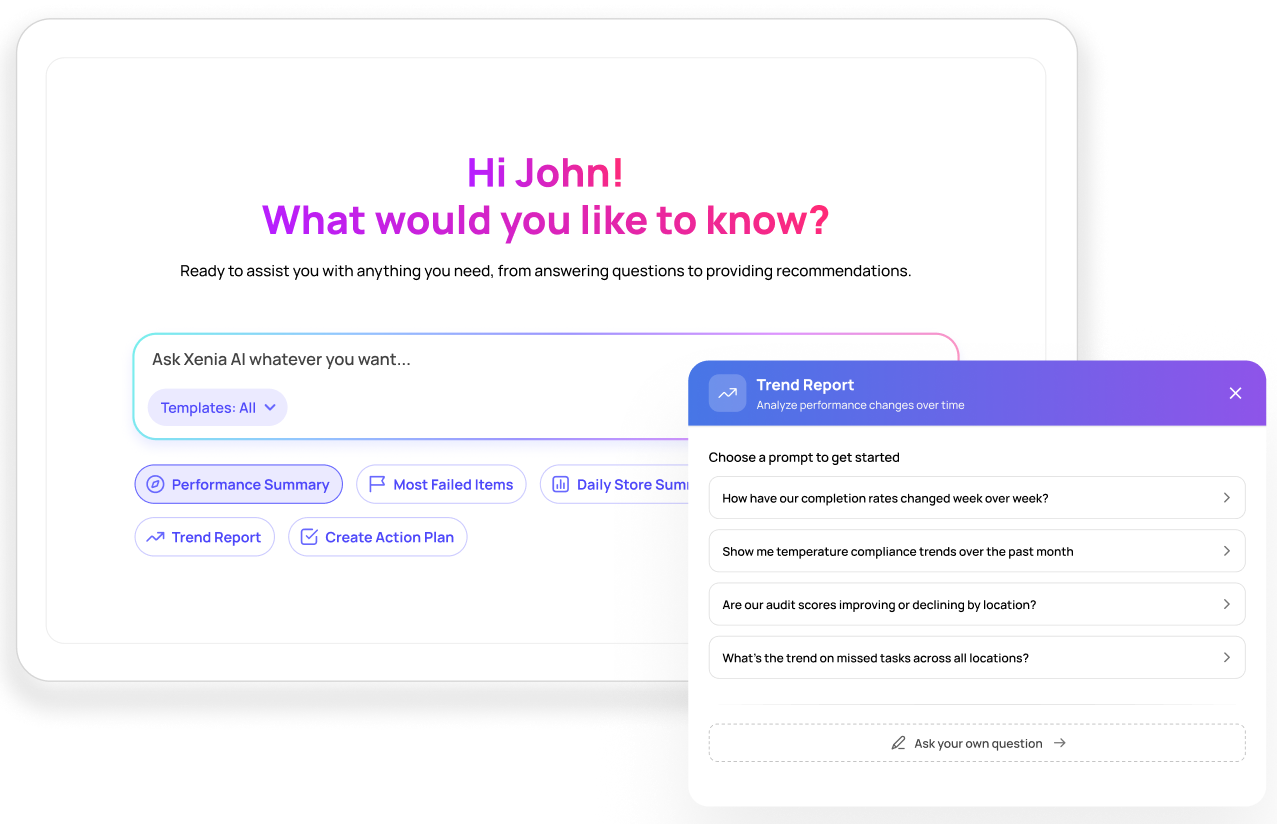
Automated Trend Analysis
Track which issues are improving, what’s worsening, and which locations consistently underperform on specific standards with drill-down to individual submissions.
Complete Store Operations Execution Platform
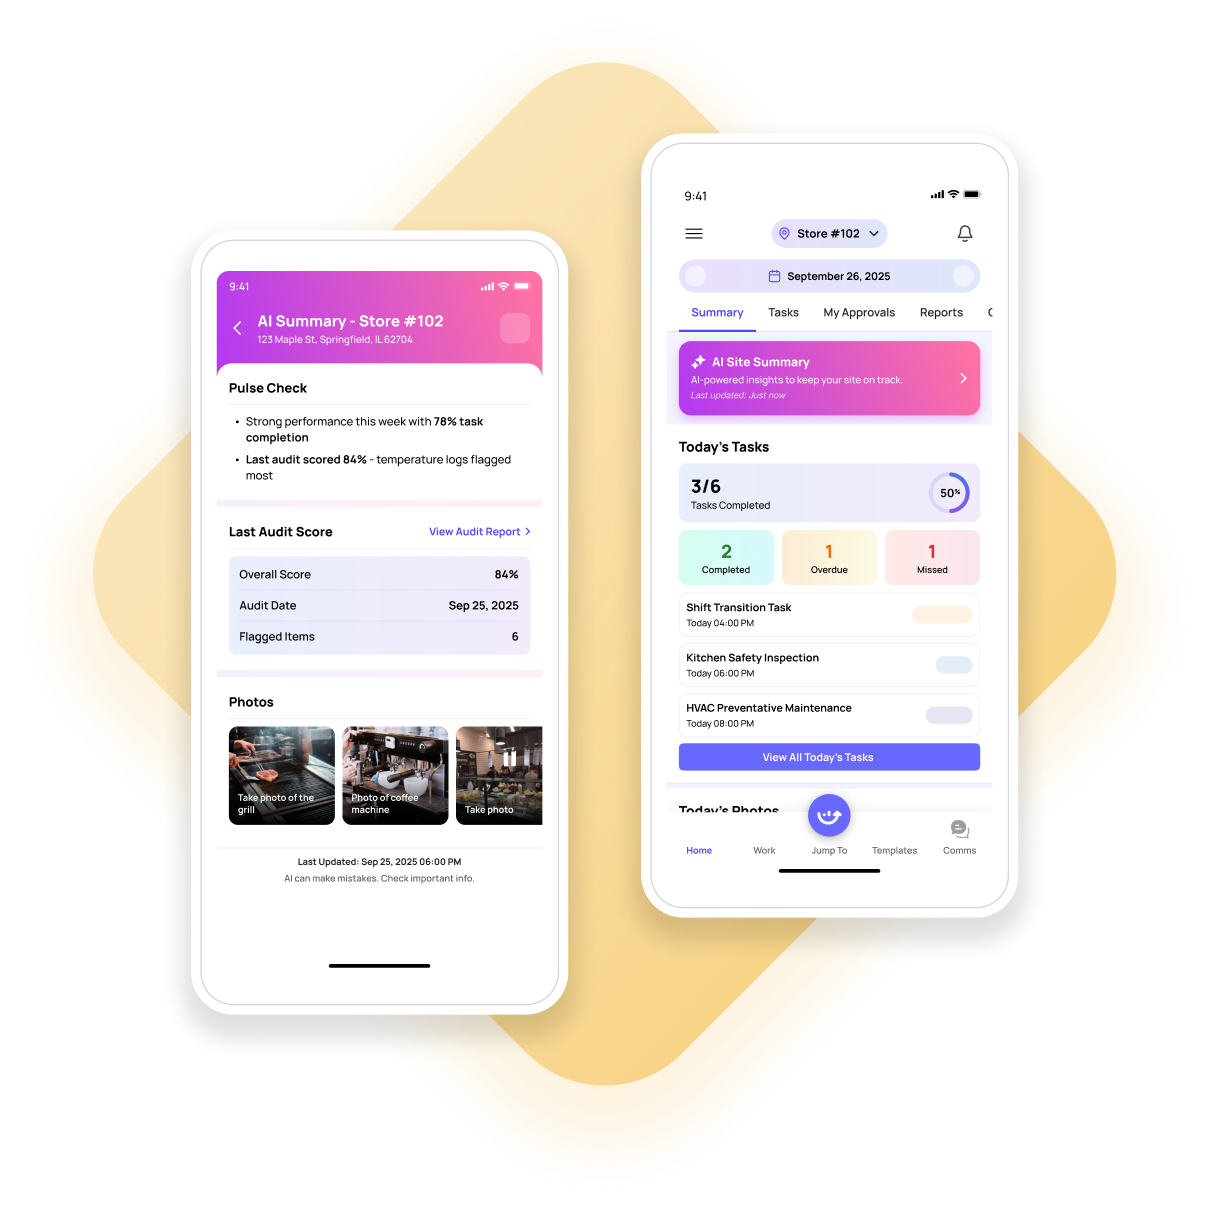
Get Real-Time Visibility Across All Locations


Autonomous Executive Summaries
Mobile-Optimized Summary Views
Automated Report Distribution
Deploy Operational Procedures Instantly Across All Sites
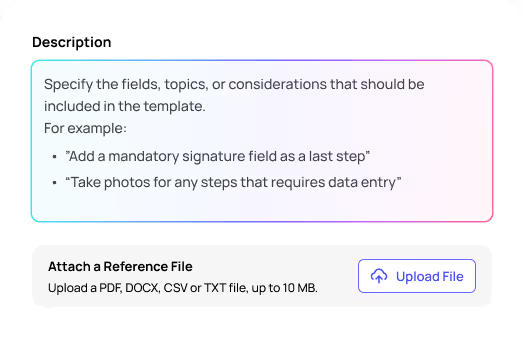
AI-Powered Template Creation
Multi-Location Execution
Simplified Task Management
Turn Unstructured Operational Data Into Actionable Intelligence

Automatic Training Gap Identification

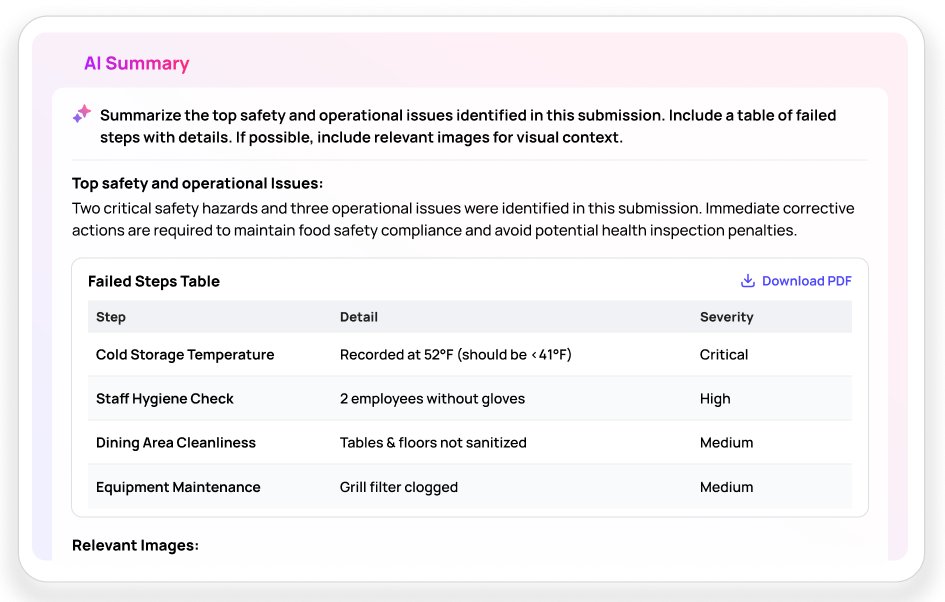
Per-Submission Summary Reports
Performance Benchmarking
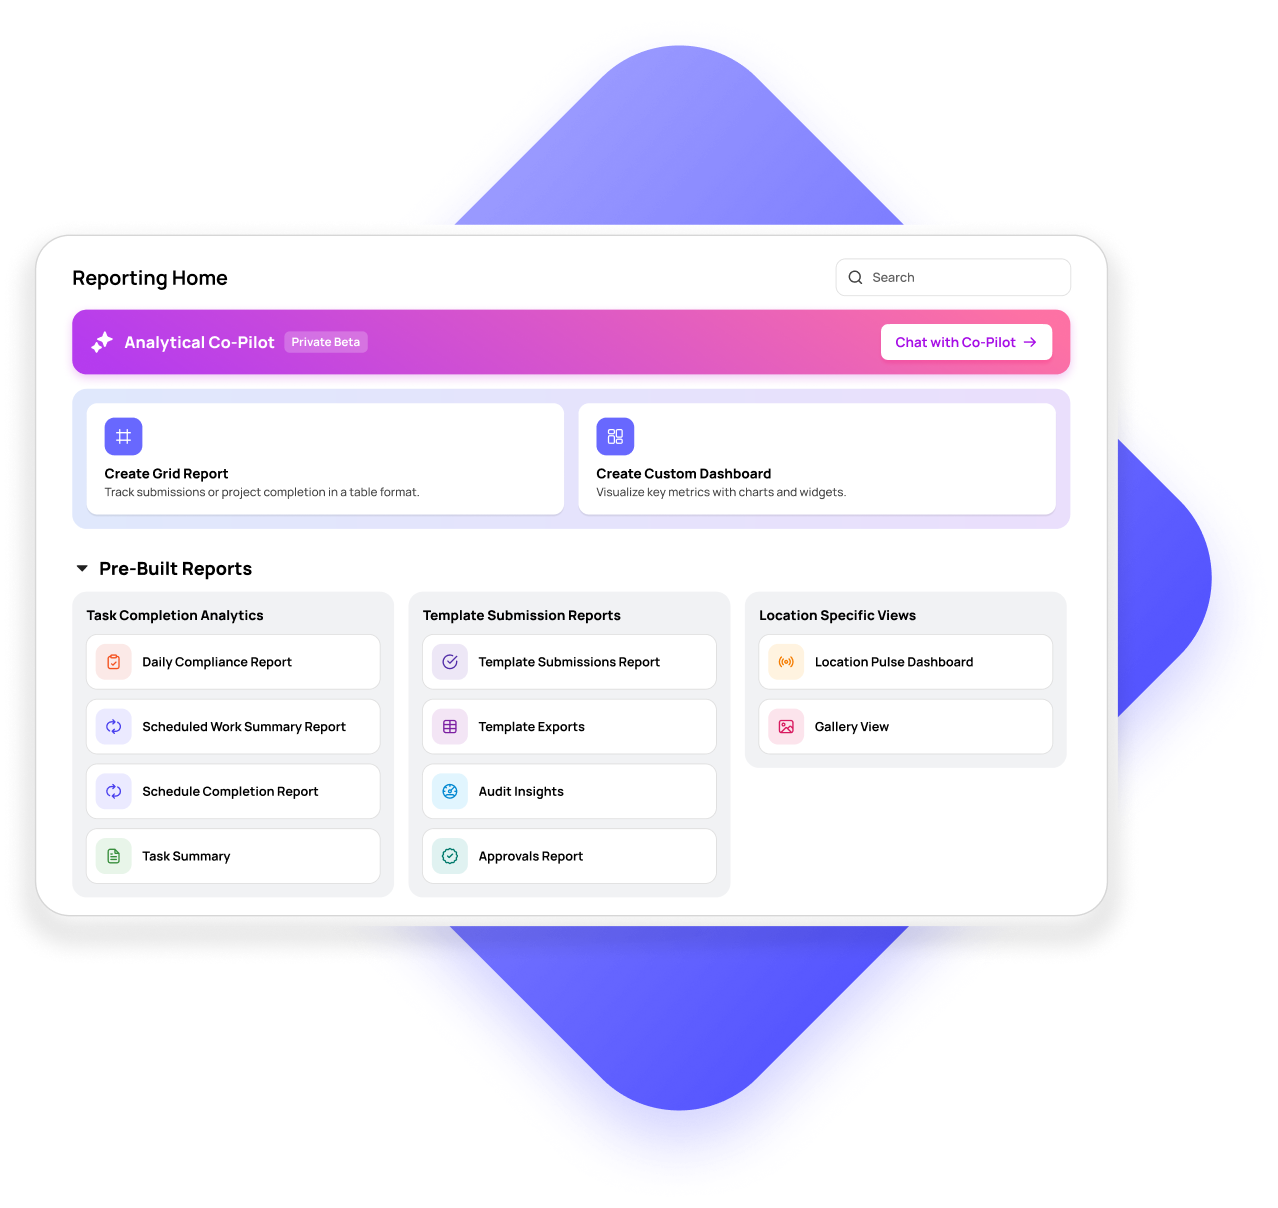
Real-Time Visibility into Operations Completion & Performance

Centralized Operations Hub
Real-Time Performance Insights
Location-Level Reporting and Benchmarking
Unlock the Full Power of AI-Driven Operational Intelligence
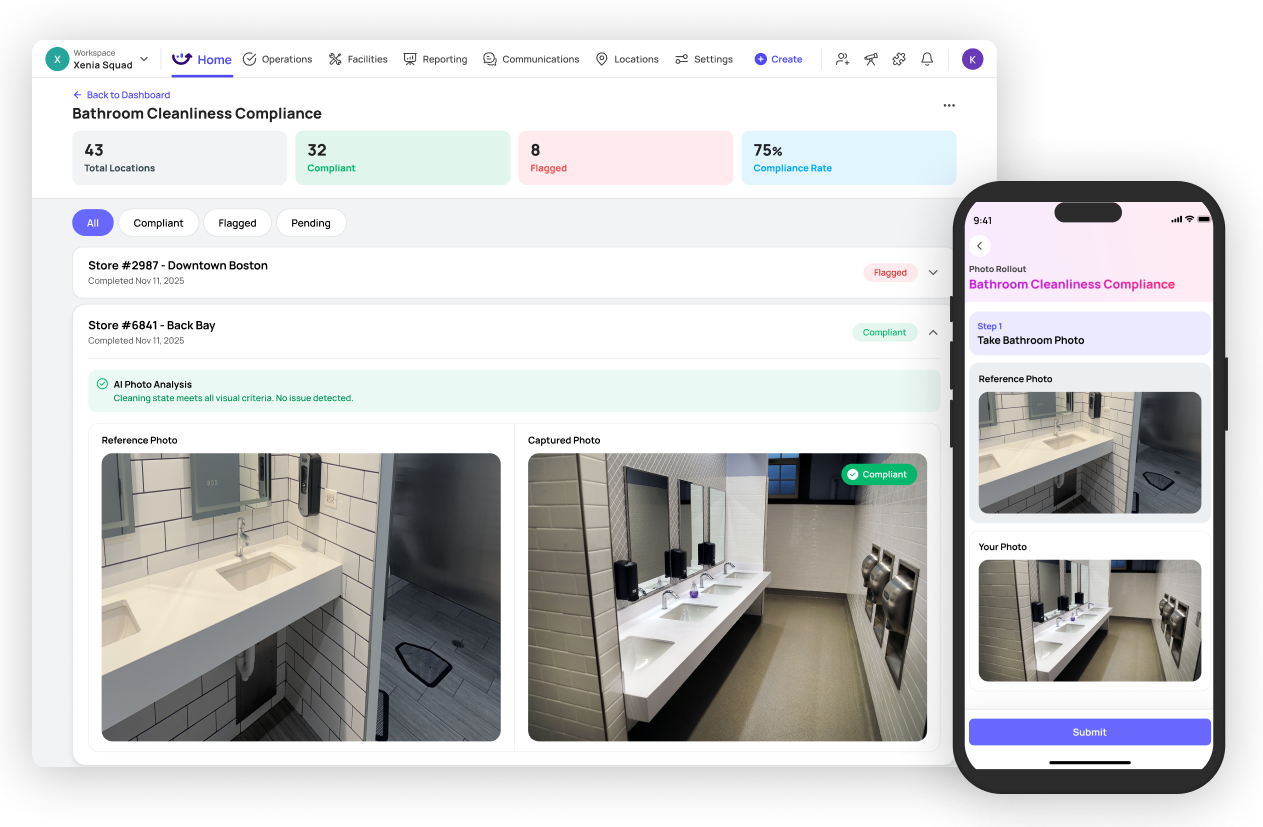


AI Photo Rollouts
Verify brand standards, check compliance, detect damaged products, and assess quality automatically with object recognition.

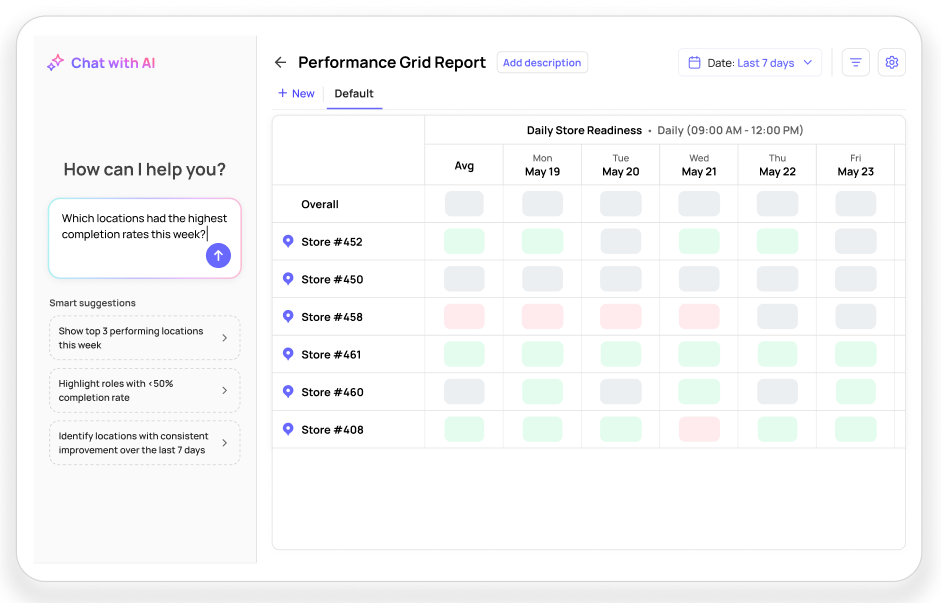
Analytical Agent
Ask questions about your operational data in plain English and get instant answers without technical expertise.

Summaries
Get real-time operational insights delivered automatically. Surface critical issues and prevent compliance violations with intelligent prioritization.

Template Agent
Convert paper checklists into digital workflows instantly or build new templates from text prompts.

AI Photo Rollouts
Shows photos and analyzes them at scale to measure consistency across all your locations.
AI Photo Rollouts
Shows photos and analyzes them at scale to measure consistency across all your locations.
AI Photo Rollouts
Shows photos and analyzes them at scale to measure consistency across all your locations.
AI Photo Rollouts
Shows photos and analyzes them at scale to measure consistency across all your locations.
Easy Integration with Your Existing Systems
Get automated real-time insights delivered
Join 5000+ locations using Xenia to replace manual reporting, spreadsheet exports, and time-consuming data analysis with AI-powered operational intelligence.