
Your AI Co-Pilot for Multi-Location Operations
Hi Kris
What would you like to know?

.avif)


.webp)
.webp)
.webp)


.webp)


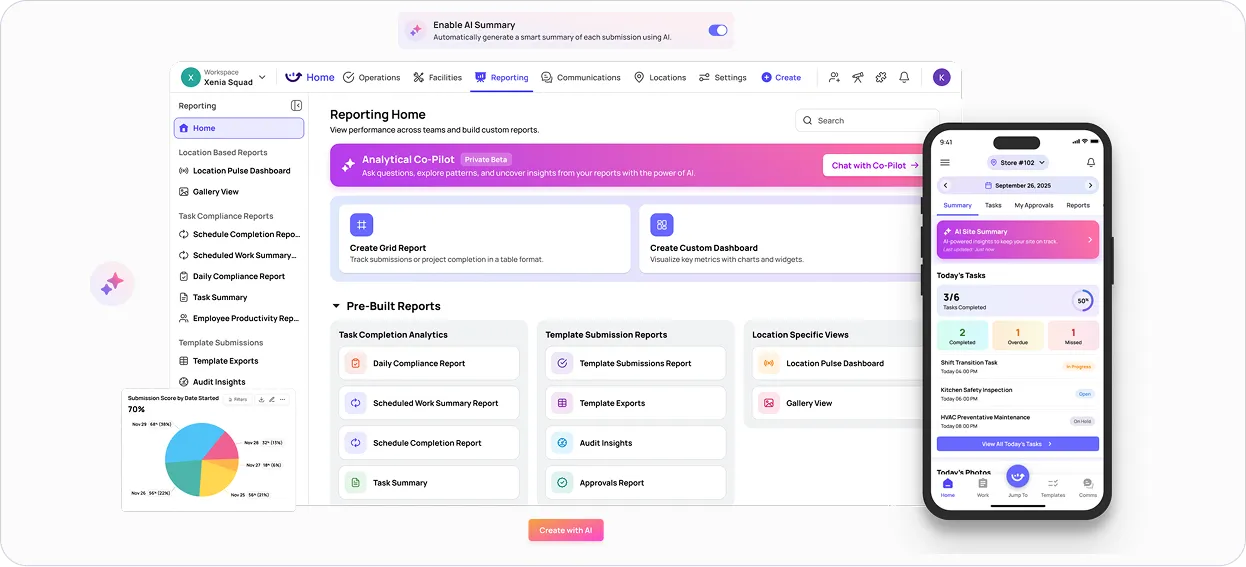
Turn Everyday Questions Into Data-Driven Insights
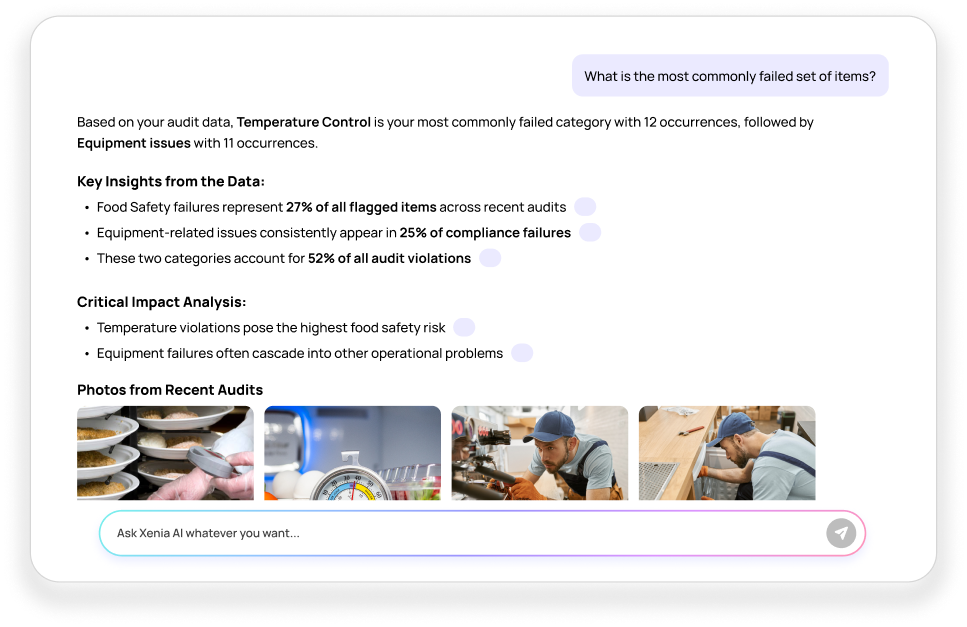
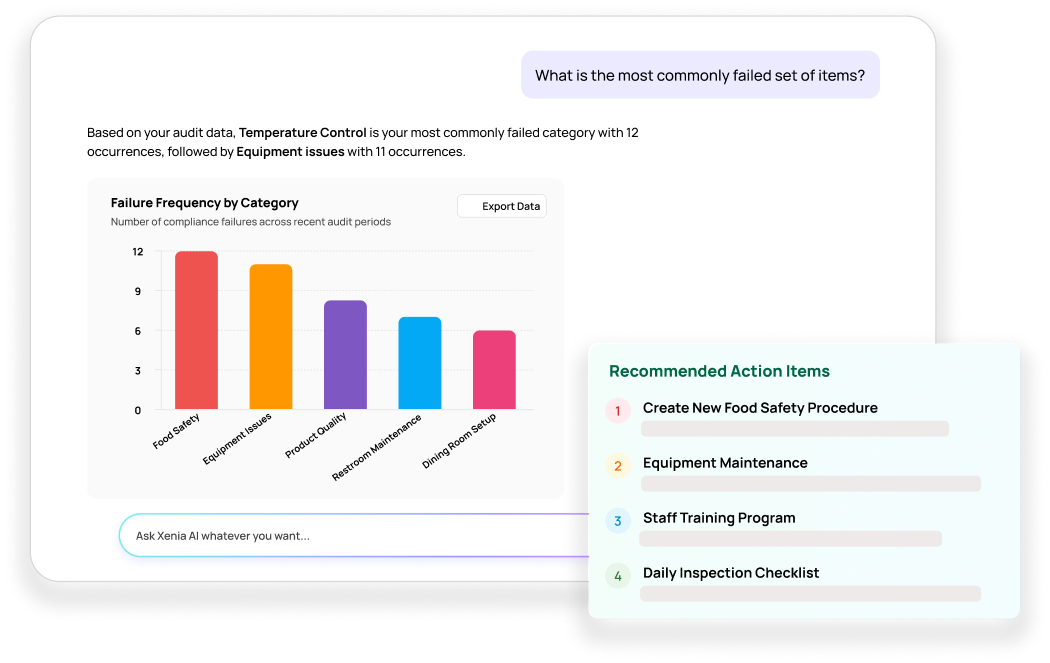
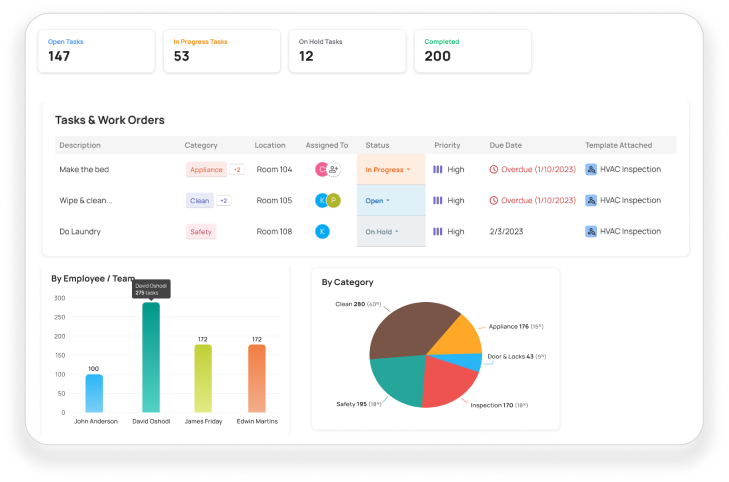
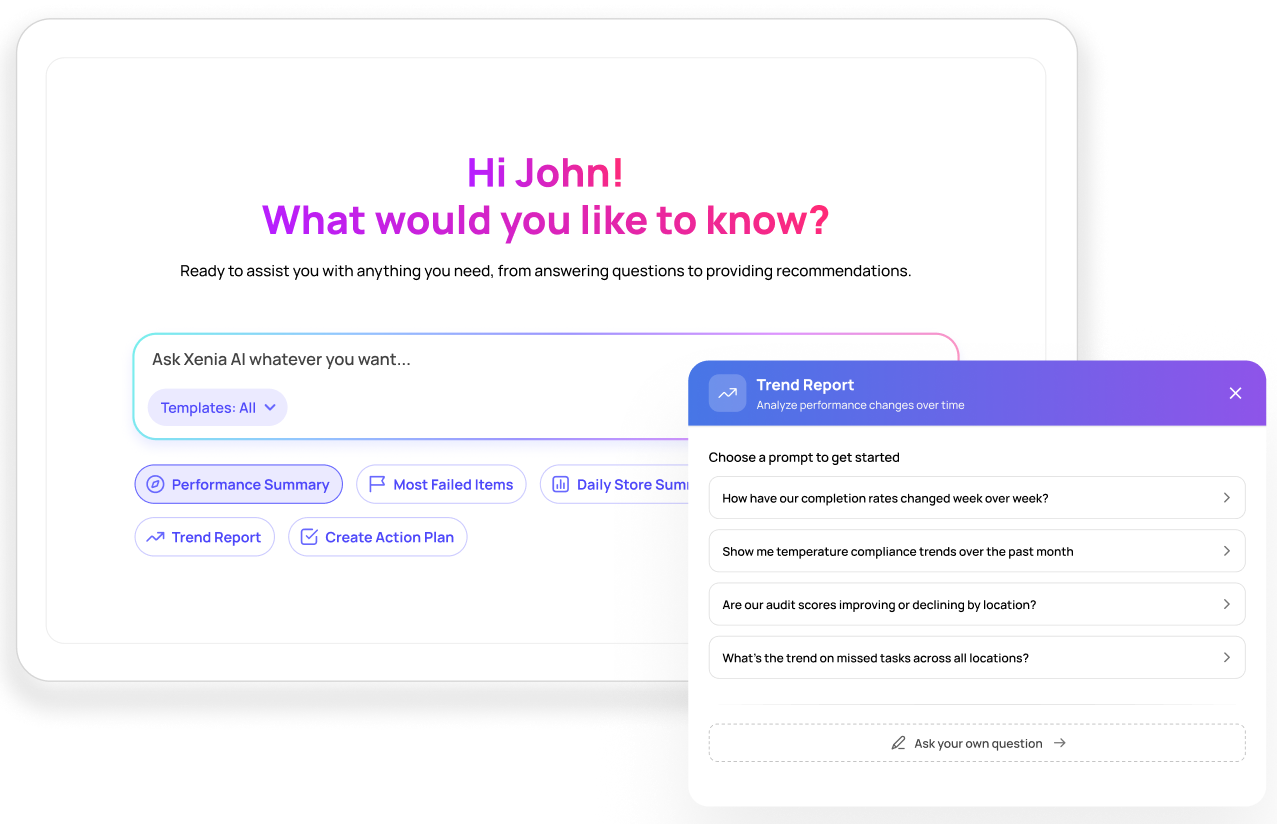
Ask Questions, Get Instant Answers
Ask your operational data questions in plain language and get actionable answers with charts, graphs, etc. Make faster, smarter decisions with real insights instead of raw data dumps.
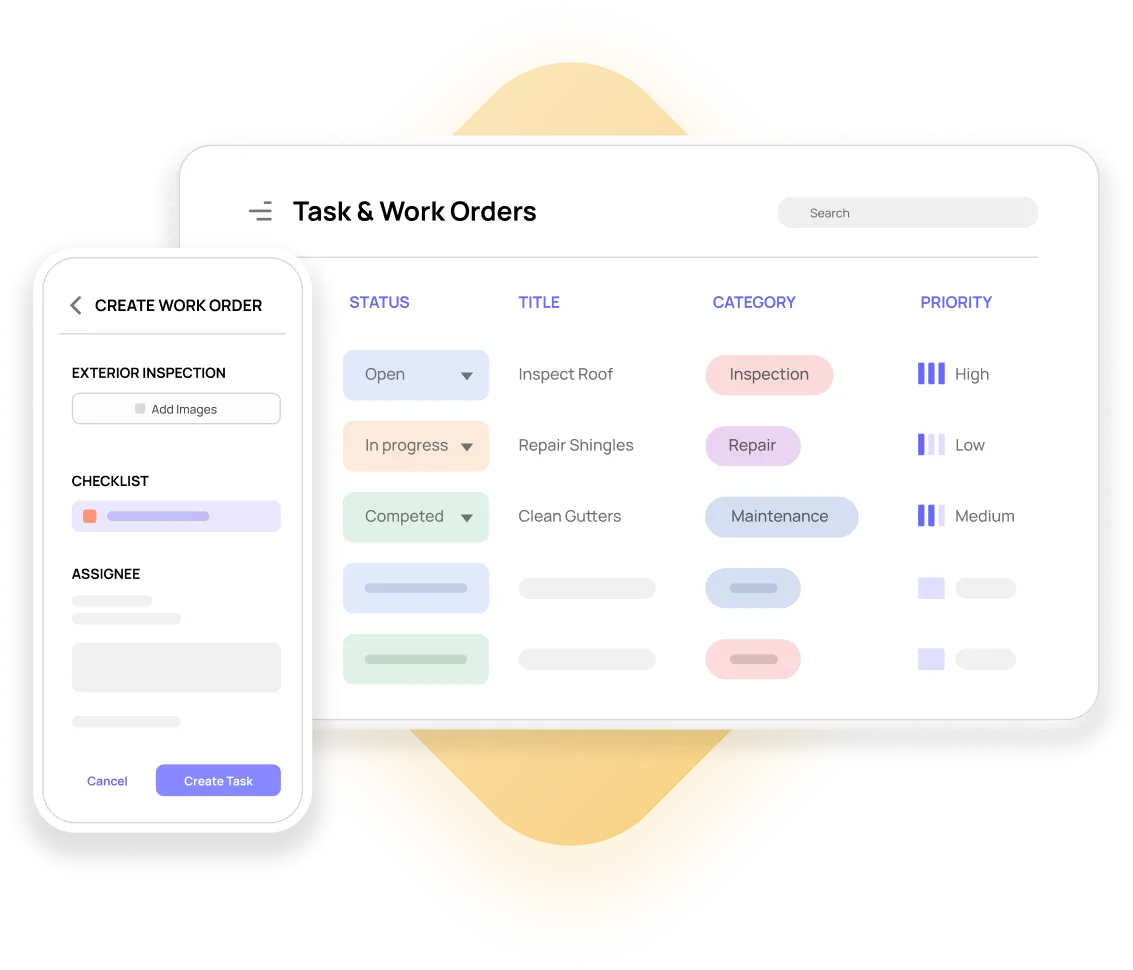
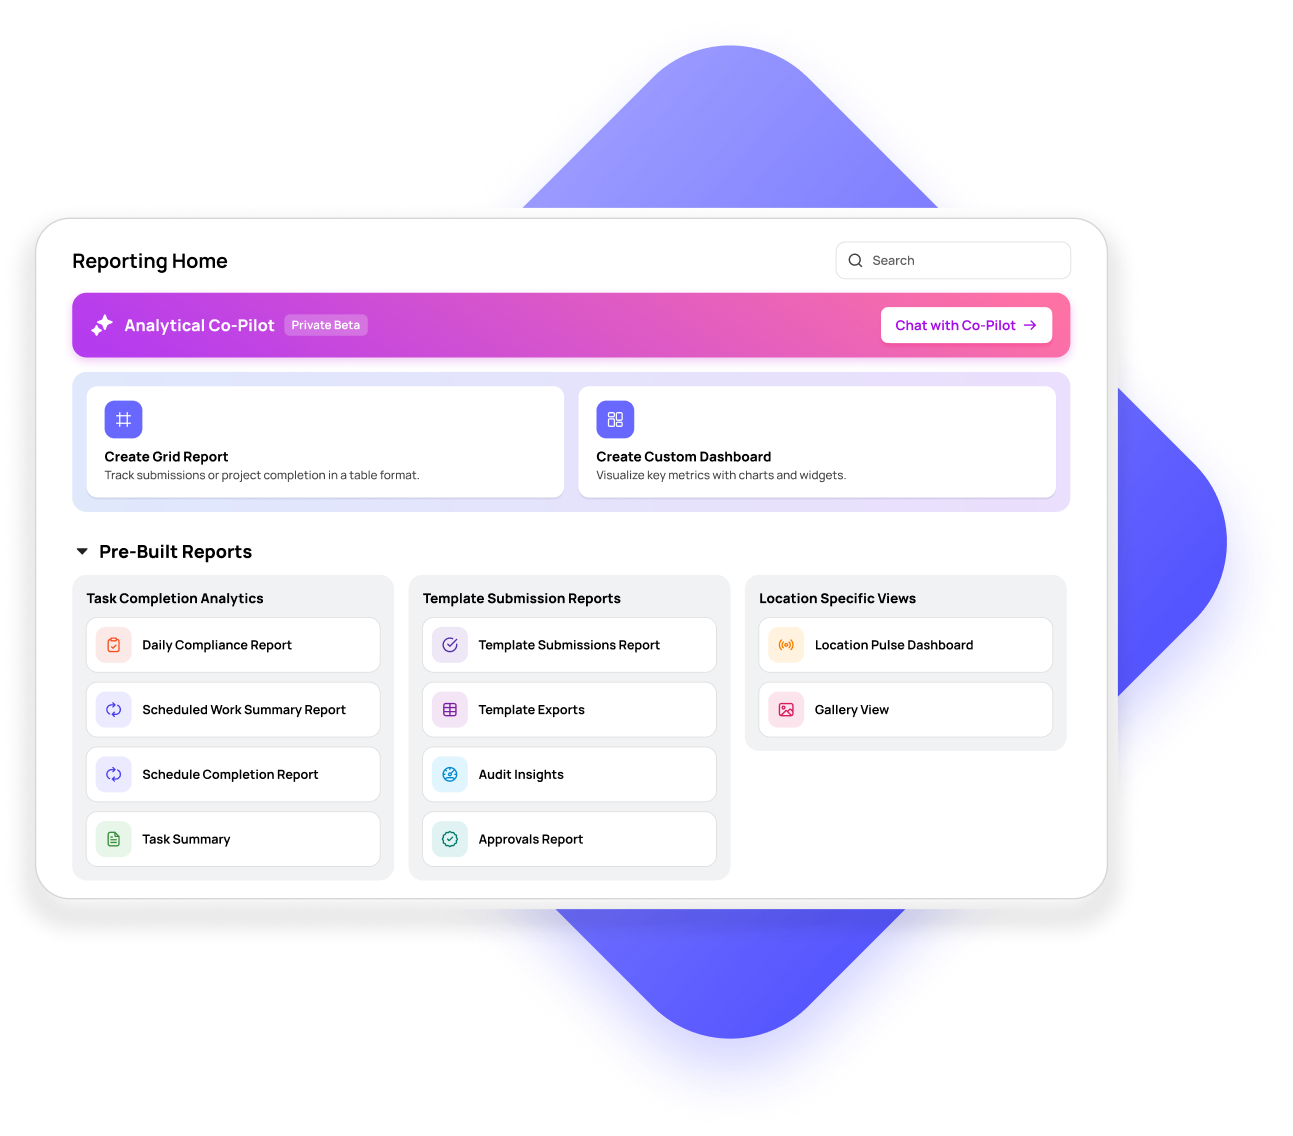
Autonomous Reporting
Self-service access to generate reports in real time on tasks, audits, incidents, and work orders. No more waiting for custom reports from IT or data teams.
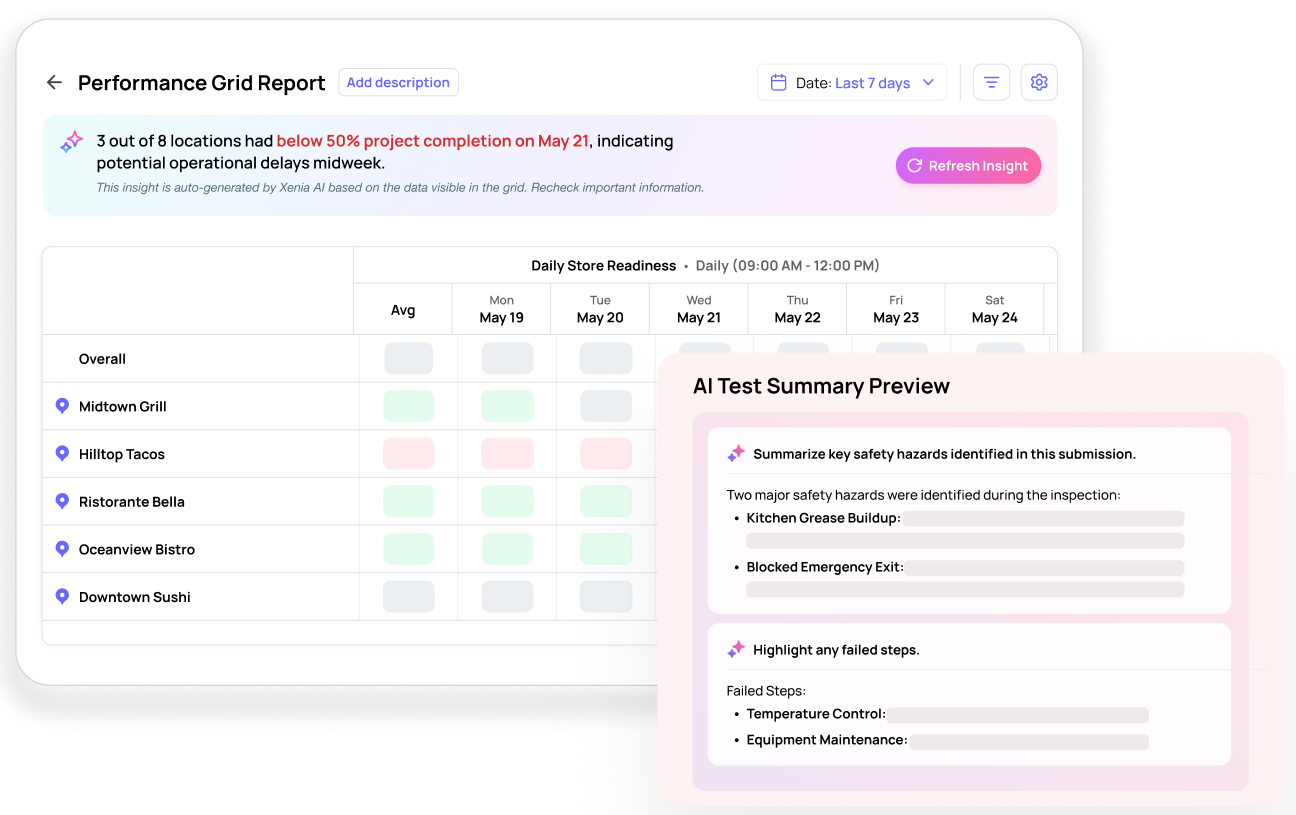
Predictive Analytics for Proactive Operations
Forecast maintenance needs, compliance gaps before audits, and underperforming locations before issues arise.
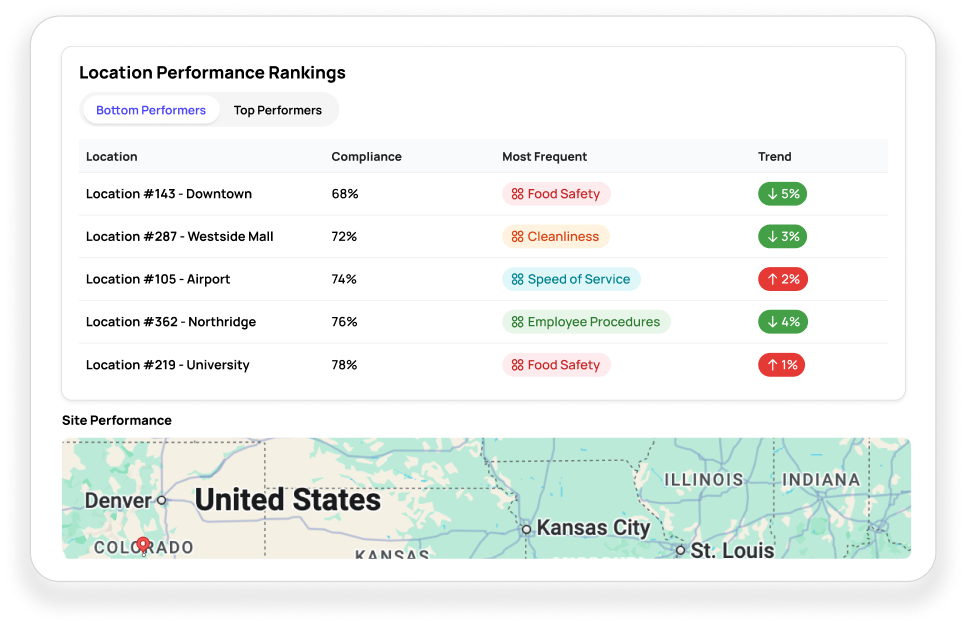
Location Benchmarking
Replicate success across all locations with confidence. Compare performance across regions, store types, or brands to identify your best and worst performers.
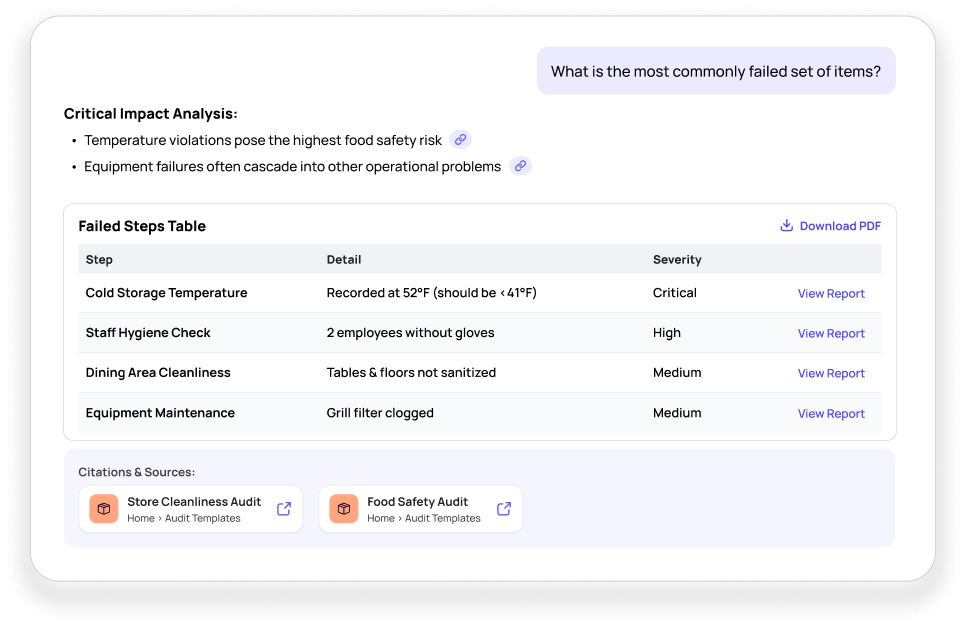
Root Cause Analysis
Connect seemingly unrelated problems to find root causes. Fix recurring issues across your business by identifying hidden connections without hours of manual work.
Complete Store Operations Execution Platform
Enable Faster Decisions With Self-Service Insights


Natural Language Query Interface
Autonomous Report Generation
Historical data analysis
Enable Faster Decisions With Self-Service Insights
Natural Language Query Interface
Autonomous Report Generation
Historical data analysis
Get Proactive Intelligence Across All Locations

Predictive Maintenance

Cross-Location Benchmarking
Continuous Improvement
Get Proactive Intelligence Across All Locations
Predictive Maintenance
Cross-Location Benchmarking
Continuous Improvement
Xenia's Suite Of AI Capabilities
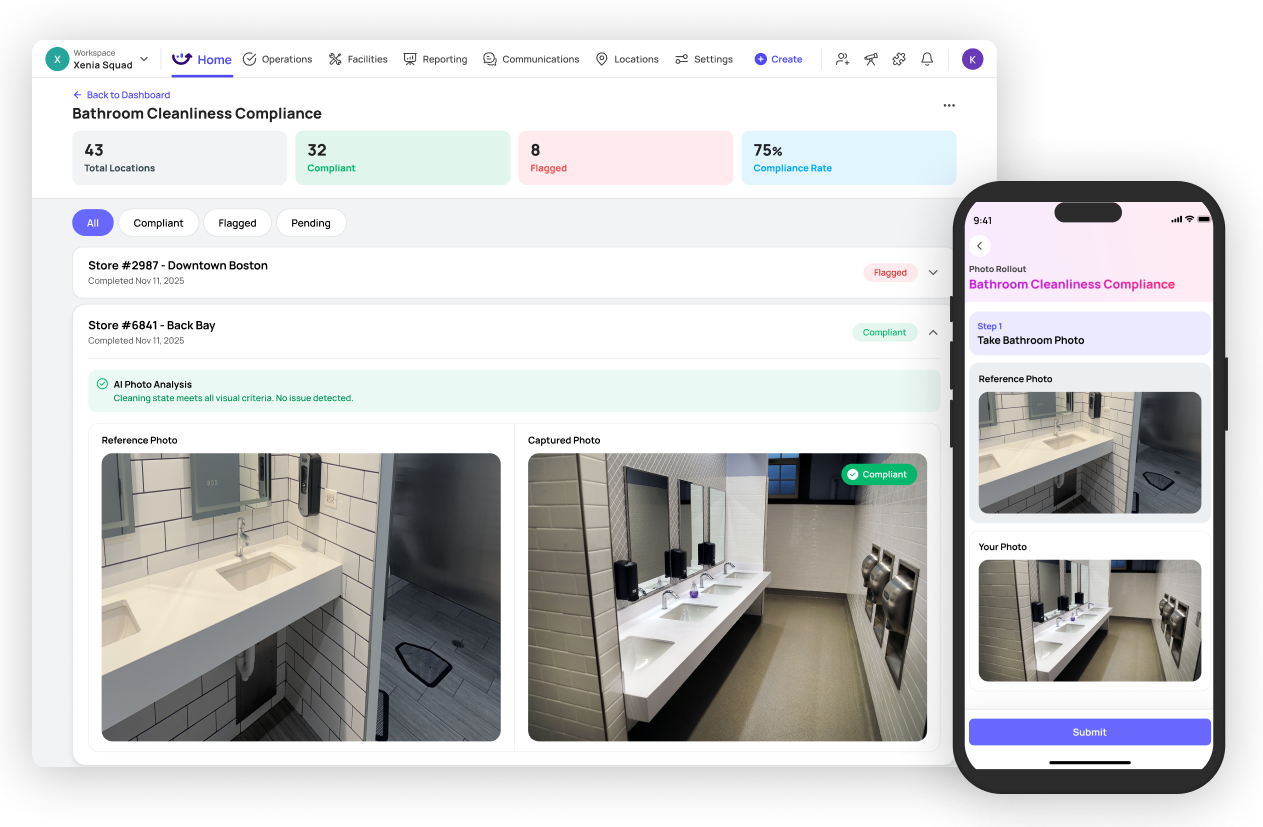


AI Photo Rollouts
Verify brand standards, safety & compliance automatically with AI-powered object recognition.

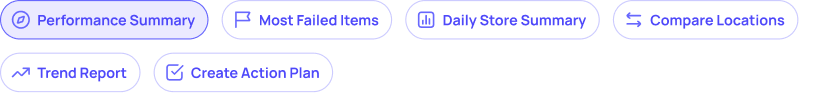
Analytical Agent
Ask questions about your operational data in plain English and get instant answers with visualizations

Summaries
Get executive reports highlighting critical issues with intelligent prioritization & trend analysis.

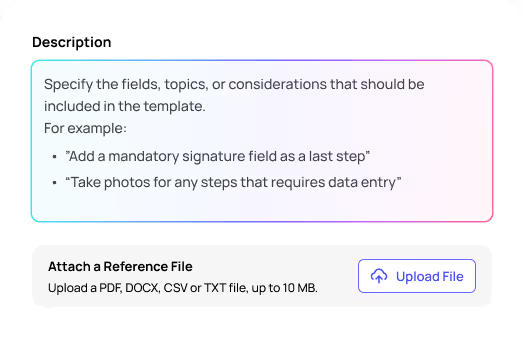
Template Agent
Create operational templates that feed high-quality data for accurate cross-location analysis.

AI Photo Rollouts
Shows photos and analyzes them at scale to measure consistency across all your locations.
AI Photo Rollouts
Shows photos and analyzes them at scale to measure consistency across all your locations.
AI Photo Rollouts
Shows photos and analyzes them at scale to measure consistency across all your locations.
AI Photo Rollouts
Shows photos and analyzes them at scale to measure consistency across all your locations.
Seamless Integration with Your Existing Systems
Turn Operational Questions into Instant Insights
Join 7000+ locations using Xenia to eliminate manual reporting, get self-service insights, and make data-driven decisions in minutes instead of days.