

Summary
What inspection management software actually does in 2026
Inspection management software runs five jobs at once: building the digital checklist, scheduling and assigning it, capturing field evidence, closing the corrective-action loop, and reporting results to ops leadership.
Single-purpose audit apps stop at the first three. Multi-unit operators need all five running in one system so a failed line item becomes a tracked work order, not an orphaned PDF.
The credible components every buyer should verify:
- Digital checklist builder with no-code template authoring, conditional logic, weighted scoring, and multi-language support
- Mobile app for the frontline with offline capture, photo and video evidence, geotagging, timestamping, and signature
- Scheduling engine for recurring inspections (daily, weekly, monthly, quarterly), event-triggered audits, and role assignment
- Corrective-action workflow that auto-creates work orders from failed items, assigns an owner, sets a deadline, requires photo verification on closure, and escalates if missed
- Multi-site dashboards showing completion, score trends, repeat offenders, and location ranking
- Audit trail that's immutable, timestamped, and exportable in PDF or CSV for franchisor and regulator review
- Integrations to POS, CMMS, temperature sensors, and BI or data warehouse
The shift from paper to digital is no longer a debate. A time-and-motion study published by Heavy Vehicle Inspection tracked 2,847 inspections across 12 operations and found mobile cut average inspection time from 18.8 minutes to 6.2 minutes (a 67% reduction), errors dropped 94%, and labor savings hit $142,000 annually per 100 daily inspections.
A separate NIH paper-versus-electronic study found omissions in paper data collection occurred at twice the rate of electronic capture. For a regulated environment, that gap is the difference between a passing health inspection and a citation.
The FDA Food Code 2022 and the FSMA Food Traceability Rule (compliance date January 20, 2026) now require electronic records and 24-hour FDA response for restaurants on the Food Traceability List, which makes paper logs untenable for any operator handling shell eggs, fresh produce, nut butters, or certain cheeses and seafood.
Buyer criteria for multi-location operators
The buyer criteria that matter for multi-location operators are different from the criteria that matter for a single store. A 200-unit chain cares about per-location pricing, role-scoped visibility, and corrective-action escalation. A single restaurant cares about template variety and ease of use.
The ten capabilities below are the multi-unit shortlist. Single-purpose inspection apps typically deliver five to seven of them.
- Weighted scoring with critical-item auto-fail. Temp failures should weigh 10 points, a misaligned menu board should weigh 1.
- Offline mode with conflict-free sync. Rural c-stores and back-of-house basements lose signal regularly.
- Auto-generated corrective-action work orders from any failed line item, with photo verification on closure.
- Photo evidence plus AI photo analysis for back-of-house standards and merchandising compliance.
- Role-based template assignment. A GM, a DM, and a corporate auditor see different question sets on the same store.
- Scheduled recurrence and geofenced completion windows. Temperature logs back-filled from the parking lot are a documented failure mode, geofencing closes it.
- Multi-site analytics, location ranking, repeat-offender flagging, and score trends across the portfolio.
- Open API and integrations to POS, CMMS, temperature sensors, and BI.
- Unlimited-user pricing. Per-seat models punish hourly multi-unit workforces and create seat-counting overhead at scale.
- Audit-trail export in PDF and CSV for franchisor brand audits and regulator review.
Conditional visibility lets you ask different questions at different locations without penalizing stores for N/A items, the patio-versus-no-patio problem solved with one template that handles 100+ format variations.
A restaurant chain running the same audit at 100 franchises can show drive-thru questions only to units with drive-thrus and patio questions only to units with patios. Pair that with audit frequency by vertical and you set the cadence and the scope correctly the first time.
Top inspection management platforms compared
The inspection management category is crowded. Most platforms started as a single-purpose audit app and bolted on adjacent capabilities later.
**
Platform, Best for, Differentiator
Xenia, Multi-unit brands (20+ sites) across restaurants-c-stores-retail-hospitality, Inspections-work orders-daily ops-chat and analytics in one app. Unlimited users-weighted scoring-AI photo analysis
SafetyCulture, Large enterprises with mature compliance teams, Deep template library-executive BI dashboards
Lumiform, Inspection-only teams wanting a free tier, 12000+ starter templates-free-forever plan
Zenput (Crunchtime), QSR and fast-casual chains, Tight POS and labor integration via Crunchtime
RizePoint, Food-safety auditing at brand-program level, Strong supplier-audit and brand-standards heritage
Bindy, Multi-unit retail-pharmacy-hospitality, Action plans-root-cause analysis
FastField, Complex custom workflows, Heavy form-building-scripting
Intouch Insight, Security-conscious enterprises, Strong IT and security posture
Jolt, Single-location to small-chain restaurants, Integrated temperature sensors
GoAudits, SMB inspections, Affordable starter pricing
**
Where each one falls short: SafetyCulture's Premium tier runs $24/user/mo, with Lite seats capped at 12 inspections a year, a seat-counting problem at scale. Lumiform and Bindy are inspection-only, no work-order layer or chat.
Zenput is sold inside the larger Crunchtime bundle, less standalone flexibility. RizePoint's UI lags newer mobile-first tools, a common migration source to Xenia. Jolt struggles above 50 locations.
FastField has a steep setup curve. Intouch Insight leans services-heavy. GoAudits is light on operational depth. Xenia is newer to enterprise BI dashboards than SafetyCulture.
A direct comparison against the two platforms operators most often replace lives at the best SafetyCulture alternatives for multi-unit operators and RizePoint alternatives for QSR. Both pages walk through the migration logic with named customers.
.svg)

Priced on per user or per location basis
Available on iOS, Android and Web


Scoring methodologies: percentage, weighted, critical-fail, nullify
Scoring methodology is the single biggest source of audit-program failure at multi-unit operators. An 87% audit score reads like a passing grade until you realize the failed 13% was the walk-in cooler temperature and three hand-wash stations. Four methodologies are in play.
**
Methodology, How it works, Best for
Percentage, Every item counts equally-total earned divided by total possible, Simple but indefensible at scale-a missing greeter scores the same as a thawed chicken breast
Weighted, Critical items carry heavy point values (typically 10)-cosmetic items carry low values (typically 1), The full mechanics live at weighted audit scoring with critical-item thresholds
Critical-fail (auto-fail), Any failure on a designated critical item drops the audit to a fail regardless of overall percentage, Used heavily in food-safety brand programs and the QSC audit framework
Nullify, Items marked N/A don't count against the score, A store without a patio isn't penalized for patio cleanliness. Pairs cleanly with conditional visibility-covered for franchise networks at franchise-tier conditional audits
**
Weighted scoring plus color-coded thresholds let you set critical items at 10 points and minor items at 1 point, the audit score that actually matters. Pass-fail thresholds drive corrective action automatically.
The regulatory frameworks operators must hit (FDA Food Code 2022, FSMA, HACCP) all assume critical-item severity, so the scoring model has to match the regulator's logic. HACCP temperature logs show how that severity model flows into daily line-level checks.
The multi-location rollout playbook
The multi-location rollout playbook is six steps. Mobile-first platforms typically deploy in 1 to 2 weeks for a small chain. Enterprise suites with custom integrations run 6 to 12 weeks. The pace is set by template migration and integration scope, not by user training.
- Inventory existing inspections. List every paper checklist, spreadsheet, and audit form in use across the portfolio. Tag each by frequency, owner, and criticality.
- Convert templates. Build digital versions with weighted scoring on critical items, conditional visibility for format variations, and follow-up questions plus required photos on failure. The AI Template Agent converts SOP PDFs to digital forms in minutes, which cuts franchise rollout time from weeks to days.
- Pilot at 3 to 5 locations. Pick representative formats (corporate, franchise, urban, rural). Run for two weeks. Adjust scoring thresholds and conditional logic based on real field data.
- Configure roles and locations. Set the location hierarchy. Scope DMs to their districts, regionals to their regions, corporate to all. Avoid over-visibility and avoid data silos.
- Train the frontline. A 30-minute walk-through per role is typical. Daily ops checklists are the gateway feature. Many customers adopt daily ops first, then graduate to audits once the habit forms.
- Roll out by region. Stagger by 5 to 10 locations per wave. Monitor completion rates and corrective-action closure on the dashboard. Adjust before the next wave.
For c-store operators evaluating the rollout path, the convenience store operations software hub shows the full surface area.
Inspection KPIs that map to risk reduction
The inspection KPIs that map to risk reduction aren't completion percentage alone. Completion percentage tells you the checklist got filled out. It doesn't tell you the underlying failure rate is climbing or that a single location is responsible for 60% of the corrective actions.
Seven KPIs every multi-unit ops leader should track:
- Critical-item failure rate by location. The count of critical-item failures per audit, trended weekly. The leading indicator for a health-inspection citation.
- Corrective-action closure time. Median time from a failed line item to verified closure. A rising trend means the loop is breaking somewhere between the audit and the work order.
- Repeat-offender rate. The percentage of corrective actions that recur within 30 days at the same location. A repeat is a process failure, not a one-off.
- Audit-score variance by location. Standard deviation across the portfolio. High variance means inconsistent execution between GMs, even at the same brand.
- Time-to-audit per location. The median minutes per audit. The Heavy Vehicle Inspection time-and-motion data benchmarks mobile at 6.2 minutes against 18.8 on paper.
- Photo-evidence compliance rate. The percentage of failed items where a corrective-action photo was captured. The audit trail is only as strong as the evidence behind it.
- Acknowledgment rate on policy rollouts. When a new allergen protocol or fuel-pricing SOP goes out, the percentage of locations that acknowledge with manager sign-off within 24 hours.
Dashboards surface what's coming up as a problem, flagged items, open corrective actions, high-risk locations, not just completion metrics. The view shows where the next failure is forming, not just whether yesterday's tasks got done.
The CDC restaurant outbreak data puts the stakes in numerical terms: 48 million foodborne illnesses, 128,000 hospitalizations, and 3,000 deaths annually in the U.S., with roughly 800 outbreaks reported per year and most originating in restaurants. A Johns Hopkins Bloomberg School of Public Health analysis modeled the cost of a single outbreak at $4,000 to $1.9 million per restaurant depending on outbreak size.
The inspection program is the risk-reduction lever. The KPIs above are how you measure whether it's working.
Where Xenia leads: weighted + conditional + corrective-action closure
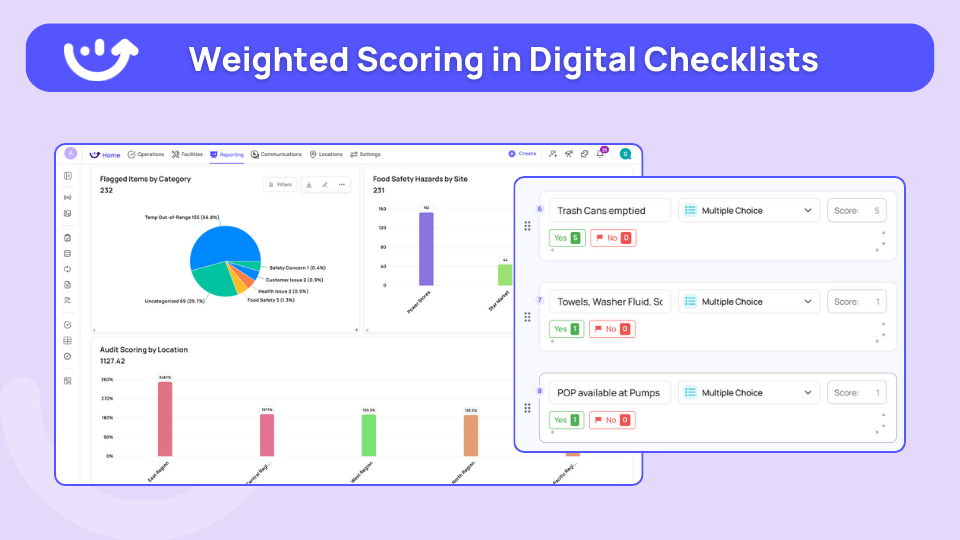
Xenia leads on the triad most single-purpose inspection apps miss: weighted scoring, conditional visibility, and corrective-action closure that runs end to end in one platform. Audit failure leads to an automatic corrective task, tracked to resolution, with escalation if not addressed by the deadline. Most platforms collect audit data. Few drive it to closure.
For a multi-unit restaurant operator, the loop runs like this: a temperature reading out of range triggers a follow-up question that captures what went wrong, requires a photo of the corrective action, assigns a task to the kitchen manager with a deadline, and escalates to the DM if it sits open past that deadline.
Pair the temp capture with Bluetooth thermometer setup for restaurants and the manual data entry disappears. Pair the corrective-action workflow with closed-loop corrective action tracking and the ops team sees every overdue item by location, region, and DM in one dashboard.
.webp)
Xenia also runs the inspection-adjacent surfaces multi-unit operators need on the same platform: daily opening, mid-shift, and closing checklists, work orders with QR-code requests for store staff and vendors with no login required, and frontline announcements with acknowledgment and digital signature capture.
The result is that one mobile app handles the inspection, the corrective action, the work order, and the manager sign-off on the new policy that prevented the failure in the first place.
Where Xenia is honest about its position: enterprise BI dashboards lag SafetyCulture for organizations with a dedicated analytics team and a BI license. For most multi-unit operators, the built-in dashboards and the AI-generated summaries cover the reporting need without a separate tool.
Frequently Asked Questions
Got a question? Find our FAQs here. If your question hasn't been answered here, contact us.
What is inspection management software?

How is inspection software different from audit software?
What's the difference between weighted and unweighted scoring?
How does conditional visibility help multi-format chains?
How long does inspection software take to roll out?
Does Xenia integrate with existing CMMS or ERP systems?


A Modern, AI-Powered Platform Built for Restaurant Operations
Xenia brings kitchen operations, food safety, audits, and team communication into one mobile-first platform. Restaurant teams execute daily work consistently, maintain compliance, and resolve issues faster, while leadership gets real-time visibility across all locations.
.webp)
Why Restaurant Operators Choose Xenia:
🤖 AI-Powered Operations, Convert paper logs instantly and verify food presentation and kitchen cleanliness automatically. Get instant answers about food safety trends without building reports.
🍽️ Food Safety & Compliance, Track line checks and temperature logs with automated alerts. Trigger corrective actions when readings exceed safe ranges. Maintain audit-ready records for health inspections.
📊 Multi-Location Control, Monitor food safety compliance and task completion across regions. Benchmark locations to identify training needs. Export reports for operational reviews.
One platform for kitchen operations, food safety, and compliance across all locations.

.svg)
.webp)
%201%20(1).webp)

.svg)
%201%20(2).webp)


