

Summary
What a preventive maintenance schedule actually is (and isn't)
A preventive maintenance schedule is the execution layer of your maintenance program. It ties every asset to its tasks, sets the frequency for each task, names an owner, and keeps the completion record. It is not the plan, and it is not a single checklist.
Here is the distinction operators get wrong. The plan decides what work each asset needs and how to do it. The schedule decides who does it and when. A checklist is one task instance. MaintainX frames it the same way in its guide on how to make a preventive maintenance schedule: planning determines the work and the method, scheduling allocates the who and the when for maximum uptime.
There are three schedule types, and picking the wrong one is why spreadsheets pile up.
| Type | Triggers on | Best for | Risk |
|---|---|---|---|
| Fixed | Calendar date | Regulatory inspections, time-based wear | Tasks stack up if a date slips |
| Floating | Completion date | Flexible ops, avoiding pile-up | Slightly less predictable timing |
| Meter or usage | Hours, cycles, miles | Fleet, compressors, seasonal gear | Needs usage data capture |
Fixed schedules run on a set interval (every 30 days, every quarter). Floating schedules count the next due date from the completion date, so the work never piles up. Meter-based schedules trigger on hours or cycles run, common for fleet and compressors, less common in restaurants and retail.
Why bother running it on schedule? Maintenance done on a calendar beats reactive repair on cost and downtime. Deloitte Insights reports that predictive maintenance programs cut unplanned downtime 30 to 50 percent and lower maintenance costs 10 to 25 percent. That is the predictive ceiling. A disciplined preventive maintenance schedule is the foundation predictive builds on. For the deep frequency-setting theory behind each task, see our sibling guide on preventive maintenance cadence and how often to service each asset.
Step 1: Asset inventory and criticality scoring
Before you schedule anything, you need a complete asset list with a unique ID for every piece of equipment, then a criticality score that tells you how often each one earns maintenance. Skip the inventory and the schedule has nothing to hang on.
A working asset inventory carries these fields per asset:
- Asset name and a unique, scannable ID
- Make, model, and serial number for parts ordering and OEM manuals
- Location, specific ("walk-in cooler, BOH," not "kitchen")
- In-service date for lifecycle and replacement planning
- Assigned owner or responsible role
Template guidance from Sockeye's free PM schedule templates and Fiix's preventive maintenance templates lines up on these fields.
Criticality scoring ranks assets by the consequence of their failure. The common method is the Risk Priority Number (RPN) = Severity x Occurrence x Detection, each scored 1 to 10. A higher RPN means higher maintenance urgency. Tractian's guide to asset criticality analysis walks the method.
- Severity: impact on operations, safety, or compliance if it fails.
- Occurrence: how likely the failure is.
- Detection: how easily you would catch it before it fails.
Criticality then maps to a strategy. High-criticality assets get frequent inspection or condition monitoring. Medium gets quarterly PM with periodic checks. Low-criticality assets run annually or even run-to-failure, where you accept controlled risk to conserve resources.
Translate it to your floor. In a restaurant, the walk-in cooler is high-criticality. It fails, you lose inventory and risk a health inspection. The decorative patio heater is low. That is the same logic Dave's Hot Chicken applies in audits across 321 locations, where weighted audit scoring gives critical items the weight and cosmetic items almost none. In a c-store, the fuel dispenser and the cooler compressor are high-criticality (revenue plus food safety). The air machine out front is low. In a hotel, guest-room PTAC units, elevators, and the boiler are high. Lobby decor is low.
Step 2: Cadence math, how often each task actually needs to run
Set cadence from three inputs in order: the manufacturer's recommendation first, then your own failure history, then the operating environment. For a brand-new asset with no history, start at the OEM interval and tighten it the first time the asset fails early.
MaintainX's six-step framework adds the rest of the inputs that matter: past failure patterns, equipment performance data, technician and operator input, and the operating environment. A high-volume kitchen wears refrigeration faster than a low-volume one, so identical equipment can earn different cadence at different sites.
Here are the cadence buckets the SERP leaders gloss over, filled with concrete restaurant and c-store frequencies:
- Daily: refrigeration temp checks and line checks. In restaurants these pair with Bluetooth thermometer auto-logging. Dave's Hot Chicken logs walk-in temps every 15 minutes across 321 locations, no manual entry.
- Weekly: check the walk-in cooler for moisture buildup and clean exterior surfaces, per WebstaurantStore's kitchen equipment maintenance checklist.
- Monthly: clean or replace HVAC filters and sanitize the walk-in interior, per Parts Town's commercial refrigeration maintenance tips.
- Quarterly: professional HVAC inspection at minimum, plus evaporator and condenser coil service.
- Semi-annual to annual: full equipment deep clean and professional HVAC service at least once a year.
One cadence gotcha decides your schedule type. Fixed schedules stack up the moment a date slips. Floating schedules, where next-due counts from completion, protect against the pile-up. This is exactly where a spreadsheet breaks. It cannot recompute due dates on completion. For the failure-curve logic and P-F interval math behind these intervals, the deeper read is our preventive maintenance cadence guide.
.svg)

Priced on per user or per location basis
Available on iOS, Android and Web


Step 3: Internal vs vendor work and the routing rules
Every PM task is either done in-house or by a vendor. The schedule has to encode which is which, who gets the ticket, and how off-cycle work gets routed when something breaks between scheduled visits. Get the routing wrong and the schedule becomes a wish list.
The internal-versus-vendor split is usually clean:
- Internal: filter changes, daily and weekly checks, cleaning, visual inspections. Store staff or an area maintenance tech.
- Vendor: certified HVAC service, refrigerant work, elevator inspection, fire suppression, fuel-dispenser certification. Anything requiring a license or a contract.
The schedule covers planned work. The expensive failures are the off-cycle ones: the pump down at 11pm, the compressor that dies between quarterly visits. This is where Xenia's QR-code work request with no login lands. Store staff or third-party vendors scan a QR code on the asset and submit a work request without logging in. The form auto-populates the asset, location, and category. A manager approves, and the request auto-routes by region, priority, and skill. Submission needs no login. Approval and assignment happen in the authenticated app.
Walk it through a forecourt. A pump goes down at 11pm. The closing attendant scans the QR on the pump. The form opens pre-filled with the pump ID, store address, and "fuel equipment." It routes to the area tech and copies the DM. No app install, no phone call. For the full third-party path, see how vendor work requests without a login let outside contractors submit tickets without a seat.
Here is the honest comparison most CMMS vendors bury. In tools like Limble and UpKeep, third-party vendor and store-staff submission still requires a seat or login. Vendors are not first-class submitters. That is the gap Xenia fills at the frontline. Limble is the right tool if you are a facilities engineer running PMs against parts inventory. Xenia is the frontline-submission and routing layer on top. See the full Xenia vs. Limble comparison for multi-unit operators. Centralizing routing and visibility (open tickets, delayed repairs, recurring failures in one view) is the multi-location value a spreadsheet cannot deliver, as Service Channel's multi-location maintenance management guide lays out.
The reactive submission flow, step by step:
- An asset breaks, or a PM task triggers on schedule.
- Staff or vendor scans the asset QR code with no login.
- The form auto-fills asset, location, and category. The user adds a note and a photo.
- A manager approves the request in the Xenia app.
- The request auto-routes by region, priority, and skill to the right tech or vendor.
- Work completes. Completion plus photo logs to the asset's service history.
Step 4: The audit trail, proving the schedule ran
You track PM completion by capturing a timestamped, photo-backed record for every task as it is done, so the schedule is not just a plan, it is a provable history per asset. This is the question the CMMS-led SERP pages skip.
The maintenance-engineer audience cares about MTBF and OEE. The multi-unit operator cares about a different question entirely: did the PM actually happen at all 200 sites, or did someone pencil-whip it? A schedule with no proof of execution is the most expensive kind of false comfort.
Here is what the audit trail captures in Xenia:
- Completion proof per task, timestamped, with a required photo. The completion percentage becomes the location's pulse, the way daily ops checklists with photo and timestamp proof work for opening and closing routines.
- Follow-up question plus required image on a failure. If a tech finds something out of range, the form asks what they found and requires a photo before they move on. Evidence is captured at the moment of failure, not reconstructed after.
- End-to-end corrective action. A failed or overdue PM auto-creates a corrective task with an assignee, a deadline, and escalation if it is not closed. Graham Enterprise migrated from Zenput partly because Zenput's data lived in reports and closure was manual. Xenia's corrective action tracking from failure to closed resolution drives the task to done.
- Dashboards that surface what is coming up as a problem, overdue corrective actions and high-risk locations, not just a completion percentage.
For safety-related PM (lockout/tagout on equipment service, fire suppression, electrical), the audit trail is your compliance evidence. When an OSHA inspector asks for proof, the trail is your answer. To be clear about the limit: Xenia does not auto-file OSHA reports or generate regulatory submissions. The trail is available. The filing is operator-driven.
The proof is in the deployments. Power Market went live across 360 locations with bilingual checklists and QR deployment, and saw 40 percent faster task resolution at Power Market. H&S Energy runs continuous sensor deployment across 360-plus stores. Mezeh cut manager phone calls 60 percent. For where this lives in your vertical, the convenience store operations software hub shows the c-store fit.
Multi-location PM: from spreadsheet to platform
No, the identical schedule should not run at every location, because not every site has the same equipment. The fix is one master template that shows each asset's tasks only at the sites that have that asset, plus a platform that recomputes due dates and rolls completion up across all locations. A spreadsheet cannot do this.
The spreadsheet breaks in predictable ways past roughly 100 assets: no recompute of next-due on completion, no cross-site visibility, vulnerable to accidental edits, and no proof a task got done. Service Channel documents the same limits for multi-location facilities.
The deeper trap is the "same schedule everywhere" assumption. A 200-unit chain does not have identical equipment. Some restaurants have patios and patio heaters. Some c-stores have food service and tap systems. Some hotels have pools. Running one rigid schedule penalizes a site for assets it does not have. Xenia solves the audit version of this with conditional visibility, the patios-versus-no-patios problem. C-store chains with mixed formats run one audit and hide irrelevant questions per location group. Huck's used conditional checklists for tap-system versus non-tap stores. Apply the same principle to PM: the schedule shows a site's tasks only for the assets that site actually has. For the mechanics, see how conditional logic handles tap-system versus fuel-only c-store formats.
| Capability | Spreadsheet | Xenia |
|---|---|---|
| One master template, conditional by site | Manual duplication | Conditional visibility |
| Auto-recompute next-due on completion | No | Yes (floating) |
| No-login work request from staff or vendor | No | QR code, no login |
| Photo and timestamp proof per task | No | Yes |
| Cross-location rollup and scoped views | No | Location hierarchy |
| Corrective action and escalation | No | Built in |
| Parts inventory and depreciation depth | No | No (use a depth-CMMS alongside) |
On scoped views: DMs see their district's PM status, regionals see all regions, and corporate sees the rollup. One account, role-scoped views. That is the multi-location answer the CMMS tools built for single-facility engineers do not lead with. For the broader restaurant fit, the multi-unit restaurant operations platform hub covers it, and our work order management for multi-location restaurants guide goes deeper.
The honest close: Xenia is the frontline work order submission, routing, and audit-trail layer, not a full CMMS. If you need parts inventory depth, depreciation, and deep vendor invoicing, you run a depth-CMMS (Limble, Service Channel) and Xenia complements it. That is exactly the Refuel pattern, Xenia for frontline ops, Service Channel retained for asset depth, with offline mode keeping rural fuel stops working when connectivity drops. Do not expect Xenia to replace your CMMS. Expect it to make the schedule provable at every site.
The preventive maintenance schedule template (free download)
A working PM schedule template has one row per asset-task, with fields for the asset, the task, the frequency, the owner, the next-due date, the status, and a notes or cost column. That row is the unit of work the whole program runs on.
Here is the full field list, drawn from the template structures at Sockeye, Fiix, and Smartsheet's equipment schedule templates:
- Asset name and ID
- Make, model, serial
- Location (specific)
- Task description
- Frequency (daily, weekly, monthly, quarterly, annual)
- Internal vs vendor
- Assigned owner or technician
- Last completed date
- Next due date (auto-recompute on completion makes it floating)
- Status (Not Started, In Progress, Completed, Overdue)
- Technician notes
- Cost, for budget tracking
A structured PM program reduces maintenance cost and extends equipment life. The most defensible hard number is still Deloitte's predictive range (30 to 50 percent downtime reduction, 10 to 25 percent cost reduction), with on-schedule PM as the foundation. You will see "15 to 25 percent cost reduction" cited across CMMS vendor blogs, but those lack a single primary source, so treat them as vendor claims, not study findings.
Grab the template and start filling rows. The catch shows up the moment you run more than one location, which is the next section. For a sense of where the spreadsheet version cracks, our breakdown of the best preventive maintenance Excel template and its limits is the honest preview.
Frequently Asked Questions
Got a question? Find our FAQs here. If your question hasn't been answered here, contact us.
What is a preventive maintenance schedule?

How is a PM schedule different from a PM plan?
How do you set PM cadence for a new asset?
Should the same PM schedule run at every location?
How do you track whether PM tasks actually got done?
What software replaces a PM spreadsheet for multi-location ops?

A Modern, AI-Powered Platform Built for Facility Operations
Xenia connects maintenance, safety, inspections, and daily operations into one mobile-first platform. Facility teams respond faster, prevent downtime, and maintain compliance, while leadership tracks performance across all buildings in real time.
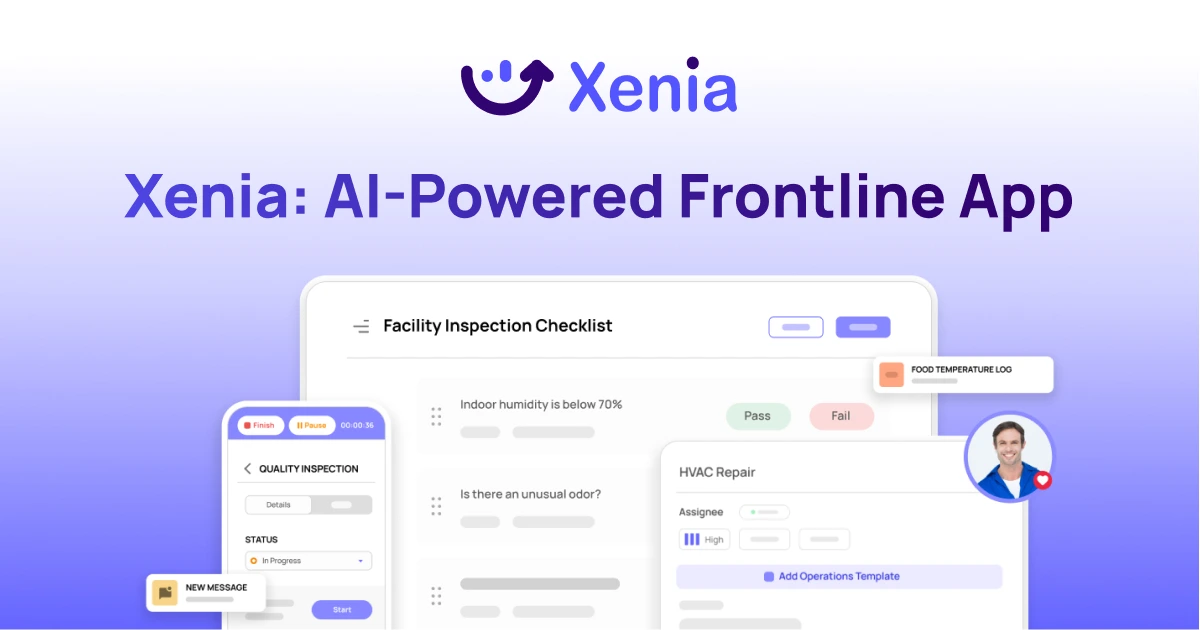
Why Facility Managers Choose Xenia:
🤖 AI-Powered Inspections, Verify safety equipment and compliance automatically with AI photo analysis. Surface critical maintenance issues instantly with AI-powered summaries.
🛠️ Work Orders & Maintenance, Report issues via mobile or QR codes. Route requests to teams or vendors. Schedule preventive maintenance for HVAC, elevators, and emergency systems to reduce downtime.
📊 Safety & Visibility, Deploy fire safety and hazard inspection workflows. Monitor work order resolution times and asset health across all facilities.
Manage work orders, maintenance, and safety inspections across all facilities from one platform.

.svg)
.webp)
%201%20(1).webp)

.svg)
%201%20(2).webp)


