

.webp)
Managing multiple frontline locations means dealing with tons of operational data.
Audit scores. Task completion rates. Equipment maintenance. Compliance metrics. Inventory levels.
You need reports that make sense of all this. Reports that show you what's working. Where to focus your attention. What needs fixing today.
Here's what's changed in 2026: AI reporting tools build reports automatically.
No more spending hours in Excel. No more manual pivot tables. No more copy-pasting data into PowerPoints.
The best AI-generated reports highlight what matters. They spot patterns you'd miss. They show you the three locations that need help right now.
This guide breaks down 7 AI reporting software that work for operations leaders.
7 Best AI Reporting Tools for Operations
**
Rank, Platform, Focus, AI Capability, Best For
#1, Xenia, Complete Operations + AI Reporting, Predictive analytics - conversational dashboards - automated summaries, Multi-location operations
#2, Tableau, Business Intelligence, Interactive dashboards, Data visualization
#3, Power BI, Microsoft Integration, AI insights within Microsoft ecosystem, Microsoft-heavy organizations
#4, Qlik, Data Visualization, Associative data engine, Complex data relationships
#5, Domo, Team Collaboration, Real-time dashboards, Large enterprise teams
#6, Klipfolio, Real-Time Insights, Live data monitoring, KPI tracking
#7, Zoho Analytics, Small Business BI, Affordable analytics, Budget-conscious small businesses
**
.svg)

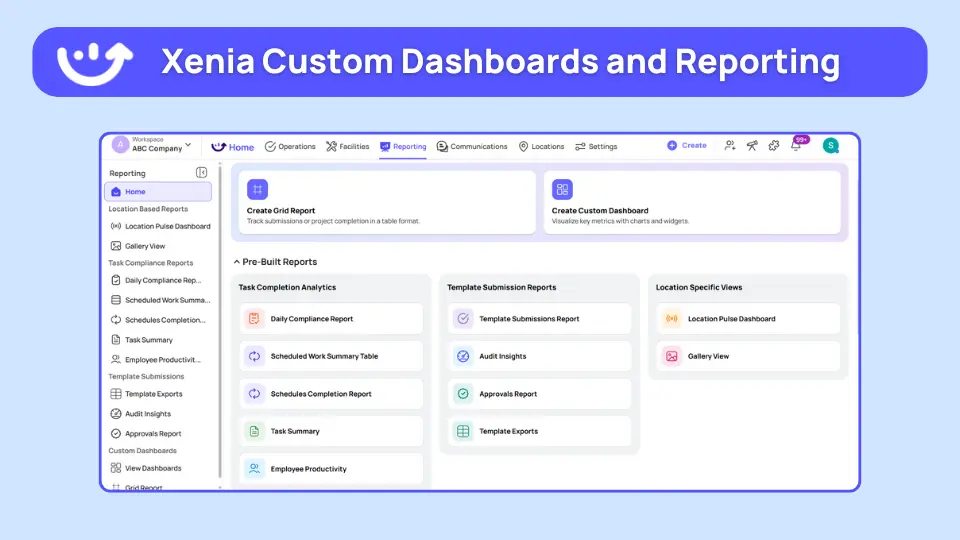
1. Xenia - Best AI Reporting App for Multi-Location Operations
- What it's for: Complete operations platform with AI-powered reporting, custom dashboards, and automated executive summaries
- G2 rating: 4.9/5
- Who uses it: Demos Restaurants, Power Market, Slim Chickens, multi-unit operations
- What makes it different: Only platform combining AI-powered reporting with complete operations execution
Xenia is the best AI reporting tool for multi-location operations that need more than static dashboards; they need intelligent reports that highlight what matters.
Here's the thing about most reporting tools: You build reports manually. Update them manually. And by the time you finish, the data is already old.
Xenia does something different. AI-generated reports create themselves automatically. They highlight anomalies. Prioritize critical issues. And answer questions in plain English.
How Xenia's AI Reporting Works
Custom Dashboard Builder: The widget-based dashboard system lets you visualize exactly what you need. Drag and drop widgets. Each dashboard updates in real-time. No manual refreshing. No stale data.
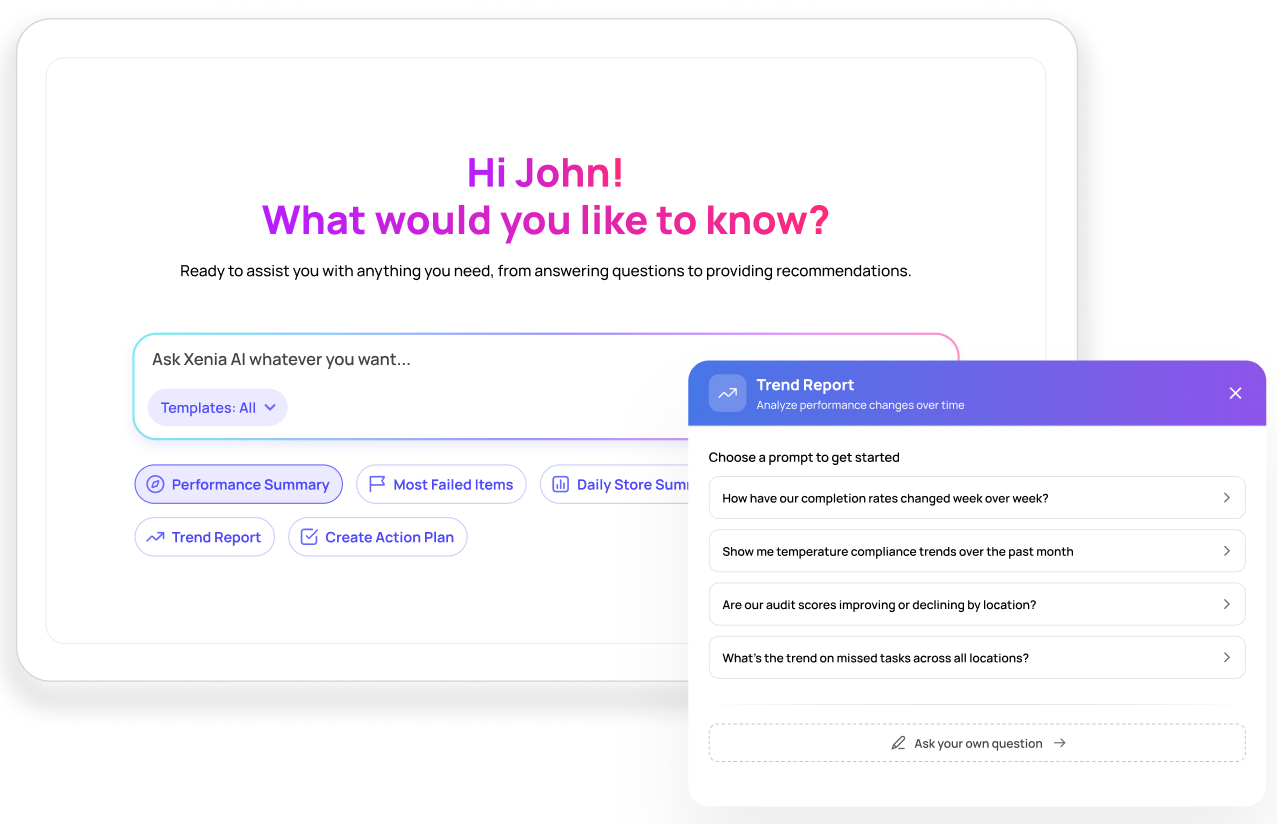
Natural Language Query Interface: You ask operational data questions in plain language. Get instant visual reports.
"Which of my 10 stores had the most safety violations last month?"
"Show me task completion trends for my Northeast region."
"What equipment requires the most maintenance?"
The Analytical Agent instantly creates visual reports answering your exact question. No custom report building. No waiting for IT.
AI-Generated Executive Summaries: Every morning, executives get AI-Powered Summaries that highlight:
- Critical issues across all locations
- Locations with declining performance
- Recurring compliance problems
- Equipment maintenance backlogs
- Task completion patterns
The AI prioritizes by severity. You know exactly what needs attention today.
Automated Report Distribution: Schedule reports to automatically email stakeholders:
- Daily compliance reports for operations teams
- Weekly performance summaries for executives
- Monthly audit trend reports for quality teams
Set it once. The reports are generated and sent automatically.
Flagged Response Tracking:
The system tracks specific failures across locations and time.
Recurring downtime issues? The report shows you which locations, which equipment, and when they happen most.
Consistent merchandising problems? You see the pattern across regions and seasons.
Trend analysis identifies systemic issues, not just individual incidents.
How Xenia Compares to Traditional BI Tools
**
What You Need, Xenia, Traditional BI Tools
Best for, Multi-location operations reporting, General business intelligence
Report creation, AI-generated + custom dashboards, Manual report building
Asking questions, Natural language queries, Pre-built reports or complex builders
Anomaly detection, Automatic highlighting, Manual analysis required
Operations data, Audits - tasks - maintenance - compliance, Varies by integration
Industry focus, Frontline operations, Generic across industries
Report distribution, Automated scheduling, Manual or basic scheduling
**
Don't Want to Switch Tools Entirely? Xenia Works With Your Existing Stack.
Most operations teams already use reporting tools. Power BI. Tableau. Qlik. Domo.
Switching everything at once isn't realistic. And it shouldn't have to be.
Xenia integrates with the tools you already use.
Here's how it works:
Pull data in. Xenia's API and native connectors pull data from your existing BI tools, POS systems, and third-party platforms into one place. Your reporting data doesn't disappear. It gets better.
Push data out. Already love your dashboards? Xenia feeds real-time operational data directly into them. Task completion. Audit scores. Compliance metrics. All synced automatically.
AI works on top. This is the key part. Even if you keep using Power BI or Tableau for visualization, Xenia's AI runs the analysis. It spots anomalies. Generates executive summaries. Highlights what needs attention.
Your existing tools handle the dashboards. Xenia's AI handles the intelligence.
No rip-and-replace needed. You add Xenia to your stack. It connects with what's already there. And your reporting gets smarter overnight.
**
What Xenia Does With Your Existing Tools, How
Pulls data from BI tools into Xenia, Native connectors + API
Pushes operational data to Power BI / Tableau, Real-time data feeds
Runs AI analysis on combined data, Analytical Agent
Generates automated executive summaries, AI-Powered Summaries
Exports reports to PDF/Excel/CSV, One-click export
**
Bottom line: Xenia doesn't replace your reporting stack. It makes it work harder.

Priced on per user or per location basis
Available on iOS, Android and Web


2. Tableau
- Best for: Complex data visualization and interactive dashboards
- Main AI thing: AI-powered insights and trend identification
Tableau is a business intelligence tool focused on data visualization. It's popular among data analysts who need to create detailed interactive dashboards.
Key features:
- Drag-and-drop dashboard building
- Real-time data connectivity
- Advanced visualization options
- Interactive data exploration
Good if: You have a dedicated data analyst team and need sophisticated visualization capabilities.
Not good if: You need operational forecasting or execution tools beyond visualization.
3. Power BI
- Best for: Organizations heavily invested in Microsoft ecosystem
- Main AI thing: AI insights within Microsoft tools
Power BI integrates seamlessly with Microsoft Office applications, making it ideal for teams already using Excel and SharePoint.
Key features:
- Native Microsoft integration
- Data modeling capabilities
- Handles large datasets
- Frequent updates
Good if: Your team lives in Microsoft tools and needs familiar interfaces.
Not good if: You need operational forecasting or aren't on Microsoft.
4. Qlik

- Best for: Discovering hidden data relationships
- Main AI thing: Associative data model for pattern discovery
Qlik specializes in letting you explore data from multiple angles using its associative engine.
Key features:
- Associative data exploration
- Interactive visualizations
- Self-service analytics
- Advanced analytics capabilities
Good if: You need to uncover complex data relationships and patterns.
Not good if: You want simple operational reporting or predictive insights.
5. Domo
- Best for: Large teams needing real-time dashboards
- Main AI thing: Predictive analytics and automated alerts
Domo provides cloud-based business intelligence with strong collaboration features.
Key features:
- Real-time data updates
- Mobile dashboard access
- Custom alerts
- Team collaboration tools
Good if: You are a large enterprise needing real-time collaboration on data.
Not good if: You are a mid-market operation or need operational execution tools.
6. Klipfolio
.webp)
- Best for: Monitoring key performance indicators live
- Main AI thing: Real-time alerts and notifications
Klipfolio focuses on real-time KPI monitoring with customizable dashboards.
Key features:
- Live data dashboards
- Customizable metrics
- Alert notifications
- Historical data access
Good if: You need live KPI monitoring and alerts.
Not good if: You need predictive analytics or operational execution.
7. Zoho Analytics

- Best for: Small businesses watching costs
- Main AI thing: Affordable analytics with AI-powered insights
Zoho Analytics provides business intelligence at accessible price points for small businesses.
Key features:
- Drag-and-drop interface
- Pre-built connectors
- Affordable pricing
- Collaborative reporting
Good if: You are a small business needing basic BI capabilities affordably.
Not good if: You need advanced operational forecasting or manage 25+ locations.
FAQs
What's the difference between AI reporting tools and traditional BI?
Traditional BI shows you what happened. Historical data. Charts. Dashboards.
AI reporting tools predict what's going to happen. They use machine learning to forecast demand, predict equipment failures, and identify compliance risks before they occur.
Traditional: "Equipment broke yesterday."
AI: "Equipment will likely fail within 7 days based on usage patterns. Schedule maintenance now."
That's the difference.
How do AI-generated reports eliminate manual work?
AI-generated reports create themselves automatically.
Instead of spending 20 hours building reports in Excel and PowerPoint, the AI analyzes your operational data and generates executive summaries highlighting what matters.
Do I still need humans if AI handles reporting?
Yes. Always. AI reporting tools handle the math, analyzing thousands of data points that you could not process manually.
Humans provide judgment, context, and local knowledge.
Can AI reporting tools integrate with my existing systems?
Yes. Modern AI reporting tools integrate with POS, inventory management, scheduling, and other operational systems.
Xenia integrates with major system,s including HRIS (Workday, ADP), POS platform,s and business intelligence tools.
Conclusion
Here's the reality.
Most AI reporting tools are built for generic business intelligence. Finance teams. Marketing departments. Sales analysis.
You need AI reporting tools that automatically highlight compliance issues. Track performance across all locations. Show you which stores need attention right now.
For multi-location restaurant operations, retail, hospitality, and convenience stores, Xenia combines AI-powered reporting with complete operations execution.
Everything connected. Reports driving execution.
See how it works for your operations.
Frequently Asked Questions
Got a question? Find our FAQs here. If your question hasn't been answered here, contact us.

Looks like there's no data available in our FAQ section at the moment.

A Modern, AI-Powered Platform Built Specifically for Frontline Operations
Xenia brings daily operations, maintenance, audits, and compliance into one mobile-first platform. Frontline teams execute work consistently across locations while leadership gets real-time visibility.
Why Multi-Location Operators Choose Xenia:
🤖 AI-Powered Operations, Create digital checklists instantly or convert paper forms with AI. Verify compliance automatically with photo analysis and get instant answers from your operational data.
✅ Daily Operations & Maintenance, Assign work across hundreds of locations in minutes. Report and route issues instantly. Schedule preventive maintenance to catch problems before downtime.
📊 Real-Time Visibility, Track completion, work orders, and performance across all locations through dashboards. Filter by site or asset to spot trends and take action.
Manage operations, maintenance, and compliance across all your locations from one platform

.webp)
%201%20(1).webp)

.svg)
%201%20(2).webp)


.webp)


