


Most frontline managers know when something is wrong with their maintenance program.
Equipment breaks down too often. Repairs take too long. The same issues keep coming back. But feeling it and knowing exactly where to fix it are two very different things.
That is where maintenance KPIs come in.
Without the right maintenance KPI metrics, you are managing by gut feeling. With them, you can see exactly where your program is breaking down and fix it before it gets worse.
This guide covers the 10 most important maintenance KPI examples, the maintenance KPI formulas behind each one, what good looks like, and how to track them without building a spreadsheet from scratch.
.svg)

Priced on per user or per location basis
Available on iOS, Android and Web


What Is a KPI in Maintenance?
A KPI (key performance indicator) is a measurable value that shows how well your maintenance program is performing.
Maintenance KPIs turn operational data into clear insight. Instead of asking "is our maintenance program working?" you can ask specific questions.
- How long does it take to repair equipment after it fails?
- What percentage of our maintenance is planned versus reactive?
- How much of a technician's day is actually spent doing maintenance work?
Each question has a metric behind it. The KPI maintenance examples in this guide cover everything from repair speed to technician productivity to equipment reliability. Each one tells you exactly where to improve.
Why Maintenance KPIs Matter for Frontline and Multi-Unit Operations
When you manage one location you can see what is happening. Walk the floor and you know exactly what needs attention.
Managing ten, twenty, or fifty locations is different. You cannot be everywhere. Whether you are building a KPI for maintenance department reporting or tracking maintenance KPIs for frontline workers, the principle is the same. Without data you are guessing.
Teams that skip maintenance key performance indicators run into the same problems:
- Reactive repairs pile up because nobody catches issues early
- Maintenance backlogs grow without anyone noticing
- The same equipment keeps breaking because nobody spots the pattern
- Technician time gets wasted while critical equipment goes unserviced
- Budget conversations go nowhere without numbers to back them up
Maintenance KPIs give every manager the visibility to stay ahead of problems across every location.
10 Core Maintenance KPIs Every Frontline Manager Should Track
1. Planned Maintenance Percentage
How much of your maintenance is planned versus reactive.
**
Formula, PMP = (Planned Hours / Total Hours) x 100
Example, 60 planned out of 80 total = 75% PMP
Benchmark, Target 70% or higher. Below 60% means your team is reacting more than preventing
**
2. Preventive Maintenance KPI: PM Compliance
Whether your scheduled maintenance is actually getting done on time.
**
Formula, PM Compliance = (Tasks Completed on Time / Tasks Scheduled) x 100
Example, 32 completed on time out of 40 scheduled = 80% compliance
Benchmark, Target 90% or higher. Below 80% means your schedule is not being followed
**
3. Mean Time Between Failures (MTBF)
How long equipment runs before it breaks.
**
Formula, MTBF = Total Operational Time / Number of Failures
Example, Walk-in cooler ran 720 hours and failed 3 times = 240 hours between failures
Benchmark, Track the trend. Improving MTBF means your PM program is working
**
4. Mean Time To Repair (MTTR)
How long it takes to fix equipment after it breaks.
**
Formula, MTTR = Total Repair Time / Number of Repairs
Example, 20 total repair hours across 5 repairs = 4 hours per repair
Benchmark, For critical equipment target under 4 hours
**
5. Maintenance Backlog
All the work identified but not yet done.
**
Formula, Backlog = Open Work Order Hours / Available Technician Hours per Week
Example, 120 open hours with 40 available hours per week = 3 weeks of backlog
Maintenance backlog benchmark, 2 to 4 weeks is manageable. Above 4 weeks means critical maintenance is being pushed back
**
6. Wrench Time
How much of a technician's day is actually spent doing maintenance work.
**
Formula, Wrench Time = (Time on Maintenance Tasks / Total Working Hours) x 100
Example, 3.5 hours of actual work in an 8-hour day = 44% wrench time
Benchmark, Industry average 25% to 35%. World-class operations hit 45% to 55%
**
7. Work Order Completion Rate
What percentage of work orders are getting done on time.
**
Formula, Completion Rate = (Work Orders Completed on Time / Total Work Orders) x 100
Example, 68 completed on time out of 85 total = 80% completion rate
Benchmark, Target 85% or higher. For critical equipment target 95% or higher
**
8. Reactive Maintenance Ratio
How much of your maintenance is unplanned.
**
Formula, Reactive Ratio = (Reactive Hours / Total Maintenance Hours) x 100
Example, 24 reactive hours out of 80 total = 30% reactive ratio
Benchmark, Target below 20%. Above 30% means reactive work is eating into your PM program
**
9. Cost of Maintenance per Location
How much you are spending on maintenance per location.
**
Formula, Cost per Location = Total Maintenance Costs / Number of Locations
Example, $25000 across 10 locations = $2500 per location
Benchmark, No universal number. If one location is spending significantly more than others find out why
**
10. Overall Equipment Effectiveness (OEE)
Availability, performance, and quality rolled into one score.
**
Formula, OEE = Availability x Performance x Quality
Example, 90% x 90% x 95% = 77% OEE
Benchmark, World-class is 85% or higher. Most frontline operations target 65% to 75%
**
KPI Benchmarks by Industry
These benchmarks apply to commercial frontline operations. Plant maintenance KPI benchmarks for manufacturing and industrial environments will differ significantly.
**
KPI, Restaurants, Retail, Convenience Stores
Planned Maintenance %, 70%+, 75%+, 70%+
PM Compliance, 85%+, 90%+, 85%+
MTTR (critical equipment), Under 4 hours, Under 8 hours, Under 4 hours
Work Order Completion Rate, 85%+, 85%+, 85%+
Reactive Maintenance Ratio, Below 25%, Below 20%, Below 25%
Wrench Time, 35%+, 40%+, 35%+
Maintenance Backlog, Under 3 weeks, Under 2 weeks, Under 3 weeks
**
The most important benchmark is your own trend over time. Are your KPIs improving month over month? That is what matters most.
How to Build a Maintenance KPI Dashboard Your Team Will Actually Use
A maintenance KPI dashboard is only useful if your team actually looks at it.
Here is what makes the difference:
Do not track everything at once. Start with 5 KPIs that match your biggest challenges. Get those right before adding more.
Make it visual. Use color coding. Green for on track. Yellow for needs attention. Red for critical. Your team should assess the state of maintenance across all locations in under thirty seconds.
Update it automatically. A dashboard that requires manual data entry will not get updated. Connect it to your work order system so data flows in automatically.
Review it on a set cadence. A weekly maintenance KPI dashboard review creates accountability. Issues get surfaced early. Trends get spotted before they become failures.
Make it location-specific. District managers need to see KPIs across all locations. Store managers need to see their location only. Build views for both.
Common Mistakes When Tracking Maintenance Metrics
Operations teams make the same mistakes when they start tracking maintenance KPI metrics.
Tracking too many metrics at once. Ten KPIs tracked inconsistently is worse than three tracked religiously. Start small and build.
Not connecting KPIs to action. A metric that does not trigger a decision is just a number. Every KPI should have a defined response when it falls below target.
Looking at numbers instead of patterns. Numbers change month to month. Trends tell you the real story. Always track KPIs over time, not just in isolation.
Using different definitions across locations. If one location calculates MTTR differently from another, your comparisons are meaningless. Standardize definitions before you start tracking.
How Xenia Captures and Surfaces Maintenance KPIs Automatically
Tracking maintenance KPIs manually takes hours. The data lives across work orders, technician logs, and spreadsheets. By the time you pull it together the moment to act has already passed.
Xenia's maintenance management platform captures maintenance KPI data automatically as your team works.
Work order data feeds KPIs directly. Every time a work order is created, completed, or escalated Xenia logs the data. MTTR, work order completion rate, and reactive maintenance ratio calculate automatically.
Preventive maintenance KPI tracking built in. Xenia tracks every scheduled PM task against its due date. PM compliance updates automatically as tasks are completed or missed. No manual calculation required.
Maintenance backlog visible at a glance. Open work orders are visible across every location in real time. Backlog by location, by category, and by technician is always current.
Maintenance KPI dashboard built in. Managers see KPIs across every location from one place. Filter by location, date, or equipment. Click any metric to see the work orders behind it.
Automatic escalation when KPIs fall below target. When PM compliance drops below 80% or MTTR exceeds your target Xenia escalates automatically to the right manager.
Conclusion
Maintenance KPIs are not just numbers on a dashboard. They are the early warning system that tells you where your maintenance program is breaking down before equipment fails or costs spiral.
The ten maintenance KPI examples in this guide give frontline managers a complete picture of program health. Planned versus reactive balance. Equipment reliability trends. Technician productivity. Financial efficiency. All measurable. All actionable.
Start with the five most relevant to your current challenges. Track them consistently. Review them weekly. Connect every metric to a defined response when it falls below target.
Xenia captures all of this automatically as your team works. No manual data entry. No spreadsheets. Real-time maintenance KPI visibility across every location from one dashboard.
Book a demo and see how Xenia helps frontline operations teams track and improve maintenance performance across every location.
Frequently Asked Questions
Got a question? Find our FAQs here. If your question hasn't been answered here, contact us.
Can small operations teams track maintenance KPIs without dedicated software?
Yes but only at one or two locations. Beyond that spreadsheets become unreliable. Data gets outdated. Calculations require manual work. Most teams managing five or more locations need a system that captures KPI data automatically from work order activity.
How do you improve a low planned maintenance percentage?
Start by auditing your current work order mix. Identify which reactive repairs are recurring. Build PM tasks around the equipment that fails most often. As PM tasks increase, reactive repairs naturally decrease, and your planned maintenance percentage improves over time.
Who is responsible for maintenance KPIs in a multi-location business?
Frontline managers’ own execution. District managers own the location-level performance. Operations leadership owns program-wide trends. Everyone needs visibility into the same data, but at different levels of detail.
How often should you review maintenance KPIs?
Weekly for operational KPIs like work order completion rate and maintenance backlog. Monthly for trend-based KPIs like MTBF, MTTR, and planned maintenance percentage. Quarterly for cost and OEE reviews.
What is the difference between maintenance KPIs and maintenance metrics?
All KPIs are metrics, but not all metrics are KPIs. A KPI is a metric tied to a specific goal or target. Tracking how many work orders were created is a metric. Tracking what percentage was completed on time against a 85% target is a KPI.

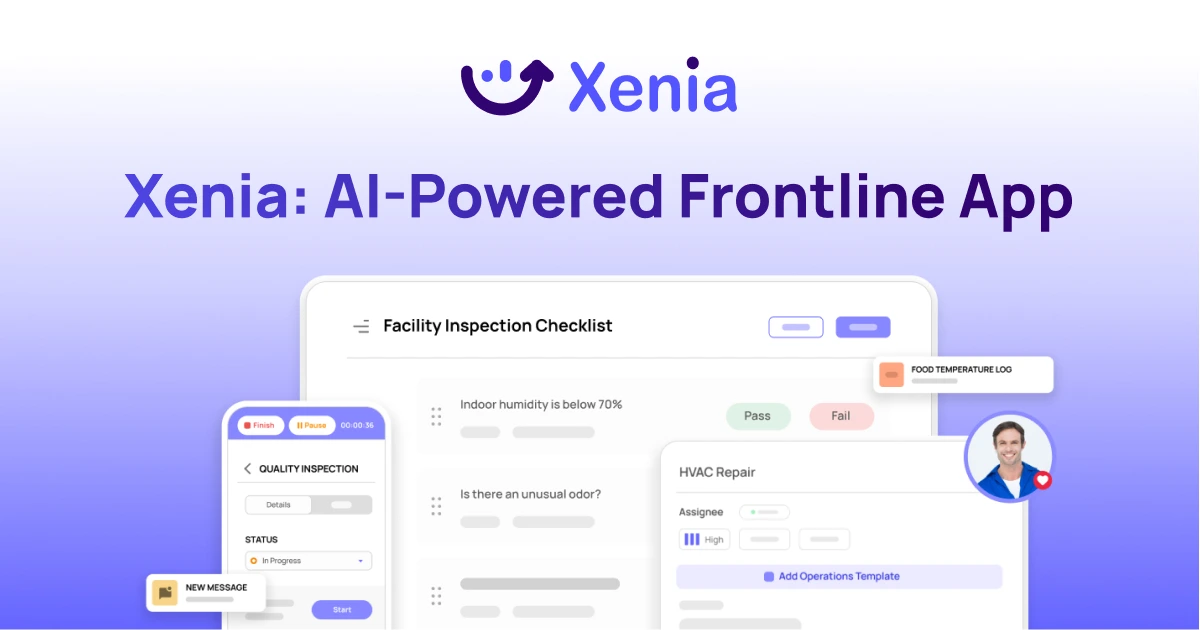
A Modern, AI-Powered Platform Built Specifically for Frontline Operations
Xenia brings daily operations, maintenance, audits, and compliance into one mobile-first platform. Frontline teams execute work consistently across locations while leadership gets real-time visibility.
Why Multi-Location Operators Choose Xenia:
🤖 AI-Powered Operations, Create digital checklists instantly or convert paper forms with AI. Verify compliance automatically with photo analysis and get instant answers from your operational data.
✅ Daily Operations & Maintenance, Assign work across hundreds of locations in minutes. Report and route issues instantly. Schedule preventive maintenance to catch problems before downtime.
📊 Real-Time Visibility, Track completion, work orders, and performance across all locations through dashboards. Filter by site or asset to spot trends and take action.
Manage operations, maintenance, and compliance across all your locations from one platform

.webp)
%201%20(1).webp)

.svg)
%201%20(2).webp)