
.webp)
Most retail operators have data. What they don't have is the right data, in front of the right people, at the right time.
A district manager visits a store and leaves with a gut feel and phone notes. A VP asks for a weekly update and waits two days while someone builds it in Excel. A compliance gap shows up during an external audit that a daily report should have caught weeks earlier.
That's not a data problem. That's a reporting problem.
The right retail store reports give every level of your team what they need. To spot problems early. To make faster decisions. To hold every location to the same standard.
Without them, you're managing blind. And that gets harder with every location you add.
This article covers 30 retail store report types used by real multi-location operators. Each one breaks down who uses it, what it shows, and why it matters.
Related resources
.svg)

Priced on per user or per location basis
Available on iOS, Android and Web


Why retail store reporting matters
Running one store is manageable. Running 10, 20, or 50 is a different problem entirely.
You can't be everywhere. You can't call every manager every morning. You can't spot a compliance issue at location 14 by instinct.
Retail store reports fix this. They replace manual check-ins, status calls, and reactive visits with real data from every location. When they work, a regional manager can see exactly what's happening across their whole territory without leaving their desk.
Here's what happens when the right reports aren't in place:
- Problems at struggling stores go unnoticed until they're serious
- District managers spend their days collecting updates instead of acting on them
- Compliance gaps only show up during external inspections, not before
- Out-of-stock items get found by customers, not your team
- Leadership makes decisions based on what they heard, not what actually happened
The right retail reporting changes all of this. Here are the 30 report types that matter most.
Store visit and site inspection reports
These reports document what's actually happening at each location. They are the starting point of any field operations program.
1. Store visit report
District managers and area directors fill this out when they visit a store. It covers how the store looks, how staff are behaving, whether merchandising is right, and any gaps they spot. The best versions get done on a phone while walking the floor. Photos get attached. If something fails, a follow-up task gets created automatically.
Who uses it: District managers, area directors, VP of retail operations
What it shows: Store condition, compliance status, flagged issues, photo proof
2. Site inspection report
A more detailed inspection document. You can filter it by location, export it as a PDF, and share it with whoever needs it. Used when a thorough, documented assessment is needed for compliance, insurance, or performance management.
Who uses it: Operations managers, compliance teams, facilities directors
What it shows: Scored results by category, flagged items, photo evidence, comparison to past inspections
3. Mobile store visit form
A simple form filled out on a phone while walking a location. Built for speed. Managers and associates submit it on the go.
Who uses it: Store managers, field teams, loss prevention staff
What it shows: Quick observations, photos, flagged items that need follow-up
**
Report type, Best for, How it gets submitted
Store visit report, Structured field visits, Mobile during the visit
Site inspection report, Formal compliance documentation, Mobile or desktop-exported as PDF
Mobile store visit form, Quick field observations, Mobile-on the go
**
Xenia's audits and inspections tool handles all three with scoring, photo documentation, and automatic corrective action creation.
Temperature log and food safety reports
For any retail operation that handles food, temperature reporting is a legal requirement. Not optional.
4. Temperature log report
Tracks refrigeration and food holding temperatures across every unit at a location. Staff can log readings manually or IoT Bluetooth sensors can do it automatically. The report records readings with timestamps, flags anything out of range, and builds a compliance history for every unit over time.
Who uses it: Store managers, food safety teams, compliance officers, C-store operators
What it shows: Current and past readings by unit, out-of-range incidents, compliance status by location
.webp)
5. Food safety incident report
Documents food safety incidents at the store level. Records what happened, when, which products were affected, what corrective actions were taken, and what follow-up steps are needed. Required for HACCP compliance.
Who uses it: Store managers, food safety managers, compliance teams
What it shows: Incident details, affected products, corrective actions, resolution status
.webp)
6. Food safety non-compliance report
A view across all locations showing food safety gaps. Breaks down non-compliant items by location, day, and category. Helps you see which stores or time periods have the most issues and whether things are getting better or worse.
Who uses it: Regional managers, food safety directors, QA teams
What it shows: Non-compliant items by location and category, trend over time, stores with recurring problems
.webp)
**
Temperature reporting approach, What it captures, Best use case
Manual staff log, Scheduled readings entered by staff, Lower-volume locations
IoT Bluetooth sensor, Continuous automated readings with alerts, High-risk refrigeration units
Non-compliance report, Food safety gaps across all locations, Regional and district managers
**
Daily compliance and task completion reports
These are the reports most district managers check every single day. They answer one question: did the right things happen at every location?
7. Daily compliance report
Shows which locations completed their opening checklists, daily tasks, and required procedures. Gives managers a clear picture across every store so they can fix gaps before the next shift starts.
Who uses it: District managers, regional managers, directors of operations
What it shows: Checklist completion by location, missed tasks, completion rate vs. prior period
8. Submission report
Tracks which forms and tasks were actually submitted across all stores over a set time. Useful for confirming that required submissions, like daily safety checks, manager walk forms, and opening checklists, happened at every location.
Who uses it: Operations managers, compliance teams
What it shows: Submission volume by location, missing submissions, submission rate by form type
9. Completion rate report
One of the most requested retail store reports. Shows a completion rate per store for the week or month. Gives leadership a quick read on which locations are executing and which are falling behind.
Who uses it: VPs of operations, district managers, regional directors
What it shows: Completion rate by location, network ranking, trend vs. prior periods
10. 7-day completion report
A rolling seven-day view of completions per store. A monthly report shows a final number. This shows you which day the drop started and how far it fell. Better for catching recent drops in performance before they get worse.
Who uses it: District managers, area directors
What it shows: Daily completion by store over the past seven days, stores with recent drops
Xenia's frontline reporting powers all four report types with real-time data, automated scheduling, and inbox delivery without anyone pulling data manually.
Store walk and manager walk reports
These reports document structured walkthroughs done at the store level. They keep standards consistent from shift to shift without a district manager needing to be there.
11. Daily manager walk report
A structured checklist completed by the opening or shift manager. Covers store condition, staff readiness, equipment status, and issues from the prior shift. One of the most valuable daily reports in retail because it creates store-level accountability without someone watching from above.
Who uses it: Store managers, shift leads
What it shows: Store condition at opening, flagged issues, shift handover notes, photo documentation
12. Walk the store score report
An audit score from a structured store walkthrough, tracked over time. Shows how a location trends on physical condition, standards, and execution. A score that drops consistently over several weeks is a warning sign worth acting on early.
Who uses it: District managers, area directors, store managers
What it shows: Walk score by store, trend over time, section breakdown, comparison across locations
Inventory and out-of-stock reports
Out-of-stock situations cost you revenue. They also push customers to competitors. These reports keep inventory gaps visible before shoppers find them.
13. Weekly out-of-stock report
Tracks average out-of-stock items at the store level across OTP, core, and cooler categories. Gives buyers and category managers a view of which products are consistently unavailable at which stores.
Who uses it: Category managers, buyers, store operations teams
What it shows: Average OOS items by category, locations with highest OOS rates, week-over-week trend
14. Weekly out-of-stock shelf report
A shelf-level OOS tracking report. More detailed than the weekly OOS summary. Tracks specific shelf positions and SKUs so store managers and merchandising teams can act at the product level.
Who uses it: Store managers, visual merchandising teams, category managers
What it shows: OOS by shelf position and SKU, store-level detail, gap vs. planogram
15. Daily inventory report
A daily review of stock levels per store. Used for high-velocity categories where inventory changes significantly within a single day. Common in food-forward retail and C-store operations.
Who uses it: Store managers, department leads, inventory teams
What it shows: Current stock levels by category, variance vs. expected, flagged shortages
16. Price exception report
Flags and tracks pricing discrepancies and price adjustment exceptions across locations. Used by loss prevention, operations, and finance to catch unauthorized price changes, errors, and potential shrinkage.
Who uses it: Loss prevention, finance teams, operations managers
What it shows: Price exceptions by location, volume of adjustments, flagged anomalies
17. Retail inventory and waste report
Tracks stock levels and waste at the store level. Common in food-forward retail where spoilage drives significant costs. Connects inventory and waste data to identify whether the problem comes from receiving, forecasting, or handling.
Who uses it: Store managers, operations directors, food safety teams
What it shows: Stock by category, waste volume, waste as a percentage of sales, trend over time
Sales and performance reports
These reports connect what's happening on the floor to what's showing up in the numbers. Every operator wants to know one thing: is daily execution actually driving results? These reports answer that.
18. Inside sales report
Shows which stores have declining inside sales and breaks it down by category so you can see exactly what's driving the drop. One of the most used reports in C-store and convenience retail because inside sales tell you directly how well a store is being run.
Who uses it: VPs of retail, regional managers, category managers
What it shows: Inside sales by location, category breakdown, declining stores ranked, trend vs. prior period
19. Category report
Shows how each product category is performing across all stores. Which categories are growing. Which are declining. Which locations are ahead or behind on specific products.
Who uses it: Category managers, buyers, merchandising teams
What it shows: Category performance by location, trend over time, top and bottom performers
20. Monthly performance report
One document per store covering everything that matters for the month. Task completion rates, work order volume, resolution time, and audit scores all in one place. No digging across multiple systems.
Who uses it: VPs of operations, regional directors, district managers
What it shows: Completion rates, audit scores, and work order metrics in one monthly summary per store
21. Trend report
Shows how a store performs over 30, 60, or 90 days. The best way to catch a store that's slowly slipping before it becomes a real problem. The retail KPI dashboard guide covers what metrics to track and why.
Who uses it: Regional managers, VPs of operations, district managers
What it shows: Performance trend by store over a selected window, direction of change, top and bottom performers
22. POS and card processing daily report
A daily summary of point-of-sale activity and card processing at each location. Used to spot unusual transaction volumes, processing errors, and cash handling issues before they grow into bigger problems.
Who uses it: Finance teams, loss prevention, store managers
What it shows: Transaction volume by location, card processing activity, flagged anomalies
Audit and safety compliance reports
These reports document how each location performs against your defined standards. They're the backbone of compliance, brand consistency, and risk management across a multi-location portfolio.
23. Monthly safety inspection report with weighted scoring
A weighted-scoring safety inspection done monthly per store. Safety-critical items carry more weight in the overall score than minor cosmetic issues. Gives operations teams a real view of location safety, not just a pass or fail.
Who uses it: Safety managers, operations directors, district managers
What it shows: Weighted safety score by location, section breakdown, trend vs. prior month, flagged items
24. Categorized audit report
Audit results broken down by category: cleanliness, safety, operations, brand standards, food safety. Shows not just how a location scored overall but which specific categories are causing the gaps. The retail audit guide covers how to structure these audits well.
Who uses it: District managers, QA teams, brand standards managers
What it shows: Audit score by category, flagged items by category, locations with recurring failures
25. Compliance export report
Compliance data exported to Excel or color-coded PDFs, sent to stakeholders on a schedule. Used when compliance data needs to go outside the operations platform to leadership, legal, or external auditors.
Who uses it: Compliance teams, legal, leadership, external auditors
What it shows: Compliance status by location in a shareable format, flagged items, historical data
26. Audit scores report
Store-level audit scoring and trends across the full portfolio. Shows which stores score consistently, which are declining, and which have specific recurring problems. For a full breakdown of how to run effective retail audits, how to conduct effective retail store audits covers the full process.
Who uses it: VPs of operations, regional managers, QA directors
What it shows: Audit score by location, trend over time, network average, lowest performers
Shift and end-of-day reports
These reports document what happened during a shift and make sure the next team starts with full context. Simple idea. Very few retail operations do it consistently.
27. Morning skimmer report
A report for the opening shift. Gives the opening manager a fast look at overnight incidents, tasks left over from the prior day, and anything that needs to be handled before the store opens.
Who uses it: Opening managers, store managers
What it shows: Pending tasks from prior day, overnight alerts, priority items for the opening shift
28. End-of-day report
The closing shift summary. Documents what was completed, what was not, any incidents that happened, and handover notes for the next team. Done consistently, it eliminates the "I didn't know about that" problem between shifts.
Who uses it: Closing managers, store managers, district managers
What it shows: Task completion for the shift, incomplete items, incidents, handover notes
29. Incident report
A template-based report for logging store incidents: customer injuries, theft, equipment failures, employee incidents. Includes photo documentation, witness details, and automatic routing to the right people. The retail loss prevention training guide covers how incident reporting connects to a broader loss prevention program.
Who uses it: Store managers, loss prevention, HR, legal
What it shows: Incident details, time and location, photos, required follow-up actions
Scheduled and automated reports
These reports run on their own and deliver data to the right people without anyone having to compile or send them. This is where most multi-location operators can save the most time.
30. Scheduled digest reports
Automatically generated reports sent to inboxes on a set schedule. Daily digests cover task completion and open issues from the prior day. Weekly grid reports show completion rates across all locations in one matrix. Monthly analytics reports summarize performance across the full network.
Who uses it: VPs of operations, regional directors, district managers
What it shows: Depends on the report type, from daily completion rates to monthly network-wide performance
**
Report type, Frequency, Who gets it, What it covers
Daily digest, Every morning, District managers, Prior day completion and open issues
Weekly grid report, Every Monday, Regional directors, Completion rate matrix across all locations
Monthly analytics, First of month, VPs and leadership, Full performance summary across the network
Compliance export, As needed, Legal and compliance, Audit data in PDF or Excel
Photo gallery report, Weekly or on demand, Leadership, Photos submitted from locations
**
Xenia's frontline reporting handles automated scheduling, delivery, and real-time dashboards across all these report types in one platform.
How retail store reports map to each role
Different people need different data. Here's a quick reference for who uses what.
**
Role, Most useful reports, What they use it for
Store manager, Daily manager walk-end-of-day-temperature log, Day-to-day execution and shift handover
District manager, Completion rate-audit scores-weekly grid, Monitoring performance across their stores
Regional director, Monthly performance-trend report-inside sales, Regional performance and decisions
VP of operations, Scheduled digests-audit scores-compliance exports, Network-wide visibility and leadership reporting
Loss prevention, Price exception-incident report-POS daily, Catching shrinkage and theft
Food safety manager, Temperature log-food safety non-compliance, Compliance documentation and gap identification
Category manager, OOS reports-category reports-daily inventory, Product performance and replenishment
**
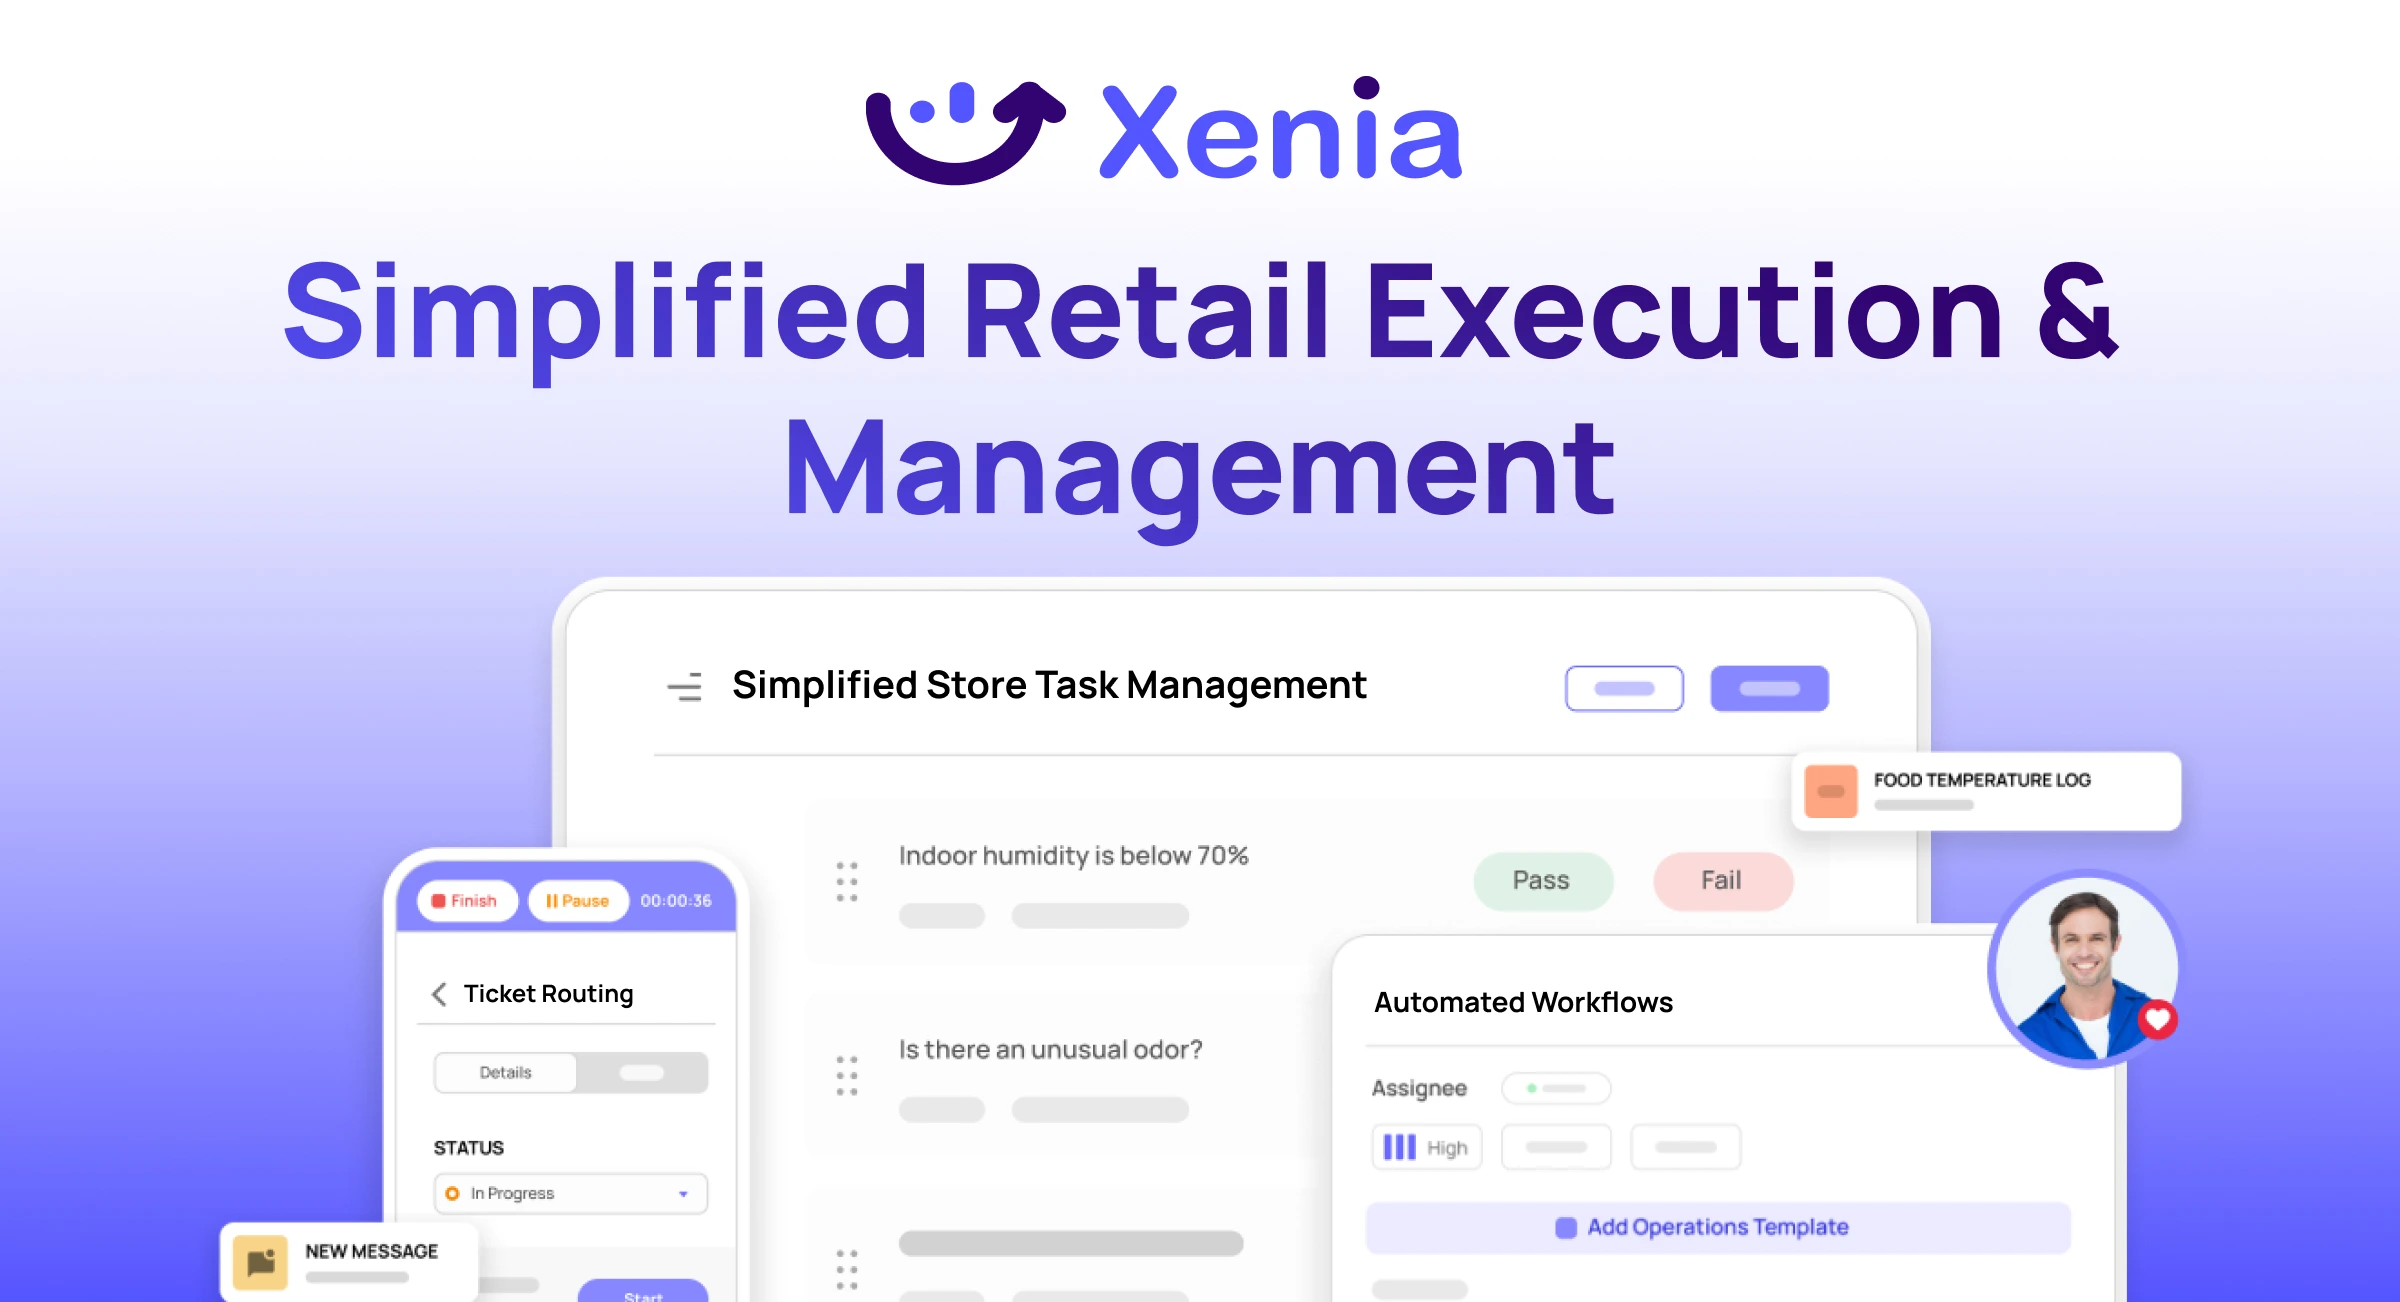
How Xenia powers retail store reporting across multiple locations
Most retail operators piece together reporting from multiple tools. Task completion in one system. Audit scores in another. Temperature logs in a spreadsheet. End-of-day reports in a shared drive nobody consistently checks.
The result is data that takes real manual effort to turn into anything useful.
Xenia's frontline reporting and multi-unit operations platform brings everything into one place. Real-time dashboards, scheduled automated reports, photo documentation, audit scoring, corrective action tracking, and compliance exports all accessible from any device.
Xenia is an operations execution platform built for multi-unit operators in retail, restaurants, and convenience stores. It handles reporting alongside task management, audits, checklists, and frontline communications without needing multiple separate tools.
See how it works for your operation.
.webp)
Conclusion
Retail store reports are not admin work. They are how multi-location operators stay in control, catch problems early, and hold every location to the same standard.
The 30 report types in this article replace the guesswork, status calls, and reactive visits that eat up most district managers' time.
The goal is simple. Every level of your organization gets the data they need, when they need it, without anyone spending hours pulling it together.
Xenia gives multi-location retail operators the reporting infrastructure to make that happen. Real-time dashboards, automated report delivery, audit scoring, and compliance tracking across every location in one place. No spreadsheets. No manual aggregation. Just the data you need, ready when you need it.
Book a demo and see how Xenia works for your operation.
Frequently Asked Questions
Got a question? Find our FAQs here. If your question hasn't been answered here, contact us.
How many types of retail store reports are there?
There is no fixed number. Most multi-location operators use 15 to 30 report types depending on their size, industry, and operational complexity. The ones that matter most are daily compliance reports, audit scores, temperature logs, completion rate reports, and scheduled digest reports.
What is the difference between a store audit report and a store visit report?
A store visit report captures quick observations from a walkthrough. A store audit report is more structured, uses a scoring system, and runs on a defined schedule for compliance or brand standards purposes. Both matter but they serve different functions.
What is a weekly grid report in retail?
A matrix-style report showing task and checklist completion for every location across the week in one view. District managers use it to quickly see which stores are keeping up and which are falling behind without reviewing individual reports one by one.
What is a retail store report?
A document or dashboard that captures operational data from a retail location. Store visit reports, temperature logs, audit scores, inventory reports, and shift handover notes are all retail store reports. The goal is consistent data from every location so managers can make decisions without being on-site.


A Modern, AI-Powered Platform Built for Retail Operations
Xenia brings store operations, merchandising, audits, and loss prevention into one mobile-first platform. Store teams execute daily work consistently, maintain brand standards, and resolve issues faster, while regional and corporate leadership get real-time visibility across all locations.
Why Retail Operators Choose Xenia:
🤖 AI-Powered Merchandising, Verify planograms, displays, and brand standards automatically with AI photo analysis. Build digital checklists instantly or convert existing merchandising guides.
🏬 Operations & Loss Prevention, Assign opening procedures, store walks, and resets across locations. Track theft, cash discrepancies, and security incidents with evidence and approval workflows.
📊 Real-Time Visibility, Compare audit scores and task completion across stores. Identify top and underperforming locations. Export reports for leadership reviews.
One platform for operations, merchandising compliance, and loss prevention across all locations.

.webp)
%201%20(1).webp)

.svg)
%201%20(2).webp)