
.webp)
A restaurant group with 12 locations recently found that labor cost at three of their highest-volume locations was running 8 to 10 points above the rest of the portfolio. Nobody had noticed for four months.
It wasn't higher wages. It was unscheduled overtime, shift swaps that were verbally approved but never recorded in payroll, and scheduling gaps that forced managers to call in staff at the last minute, often at premium rates.
Four months. Every week compounding.
This is the restaurant labor cost problem at scale. Most operators know their total number. Very few know it by location, by daypart, or by shift. That's exactly where the variance hides.
This article covers how to calculate restaurant labor cost percentage, what labor cost benchmarks actually mean for your operation, why restaurant labor costs run high, and the specific levers multi-unit operators use to reduce restaurant labor costs without cutting service quality.
Quick self-check before you keep reading:
- Do you know your restaurant labor cost percentage by location for the past 30 days?
- Do you know which dayparts are most labor-efficient at each location?
- Do you have a threshold at which labor cost triggers a manager review?
If no to any of these, this article is your starting point.
.webp)
Recommended Resources
.svg)

Priced on per user or per location basis
Available on iOS, Android and Web


What is restaurant labor cost, and how is it different from prime cost?
Restaurant labor cost is the total cost of compensating all employees, wages, salaries, overtime, benefits, and payroll taxes, expressed as a percentage of total revenue.
The restaurant labor cost formula:
Restaurant Labor Cost % = (Total Labor Cost / Total Revenue) x 100
Real example: $50,000 labor cost / $150,000 revenue = 33.3% restaurant labor cost percentage
That's the number you're managing to.
What's included in restaurant labor cost:
- Hourly wages: kitchen, FOH, and management
- Salaried manager compensation
- Overtime premiums (time-and-a-half above 40 hours)
- Benefits: health insurance, PTO, employer payroll tax contributions
- Workers' comp premiums
The relationship to prime cost:
Prime cost is labor cost plus cost of goods sold (COGS). It's the most important number in a restaurant P&L because it captures the two largest variable cost lines together.
**
Segment, Target prime cost
Full-service restaurants, Below 60% of revenue
QSR and fast casual, Below 55% of revenue
**
The labor-to-revenue ratio and food cost are the two levers that drive prime cost. For food cost benchmarks and prime cost analysis, see: Average Restaurant Food Cost
What most operators miss:
Most operators track total restaurant labor cost. The operators who actually control it track labor cost percentage by location, by daypart, and by shift. That's where the variance hides.
A 33% portfolio average doesn't tell you that location 7 is running 41% and location 3 is running 27%. The average looks fine. The P&L isn't.
What are the labor cost benchmarks for restaurants?
Restaurant labor cost benchmarks are starting points, not targets. The right number depends on your segment, geography, and service model.
**
Restaurant type, Labor cost % range
Quick service (QSR), 25-30%
Fast casual, 28-33%
Casual dining, 30-35%
Fine dining, 35-40%
Bars and nightclubs, 20-25%
**
Why geography changes everything:
Minimum wage laws, tip credit rules, and prevailing wage rates vary significantly by state and city. A 30% labor cost percentage in a $15 minimum wage market is a fundamentally different operational achievement than 30% in a $12 market. Same number. Very different effort to get there.
Wage compliance requirements also vary. Some states require daily overtime calculations. Others require predictive scheduling notice. These rules affect your restaurant labor cost formula in ways that a benchmark table can't capture.
The multi-unit benchmark problem:
A portfolio-level restaurant labor cost percentage hides location-level variance. A group averaging 31% might have one location at 26% and another at 38%. The average tells you almost nothing useful. It just tells you the math works out somewhere in the middle.
The operators who actually reduce restaurant labor costs don't just track the average. They track every location against its own target and investigate when any single location drifts outside the band.
What causes restaurant labor costs to run high?
When restaurant labor costs climb, it's almost never because wages increased uniformly. It's usually a collection of smaller failures that compound quietly until someone finally runs the numbers.
Here are the six most common causes:
1. Unscheduled overtime. A 40-hour employee who works 42 hours triggers a 1.5x premium on those two hours. Multiply across multiple employees and multiple weeks and it becomes a real number. The problem is that overtime is usually discovered on Friday when payroll runs, not on Wednesday when it could still be managed through overtime management.
2. Overstaffing during slow periods. Schedules built for projected volume rather than actual volume keep labor running high even when the floor is empty. A location that schedules six FOH staff for a Tuesday lunch that consistently does 40 covers doesn't have a wage problem. It has a scheduling gap.
3. Coverage call-ins. When staff call out, managers scramble. They call in whoever is available, often someone close to 40 hours, or someone who requires a premium rate. One poorly handled call-in can add 3 to 4 hours of unplanned overtime to a week that was otherwise on track.
4. Unapproved shift swaps. An employee swaps a shift with a colleague who already has 38 hours logged. The swap gets verbally approved. Nobody checks payroll. Unplanned overtime shows up at the end of the pay period as a surprise. Good shift coverage planning prevents this, but only if swap approvals go through a system, not just a conversation.
5. Manager time on administrative tasks. Salaried managers who spend 30 to 45 minutes per shift on checklist management, reporting, and team communication aren't on the floor. Their labor hours go toward paperwork rather than operations. This doesn't show up as a direct restaurant labor cost line. But it shows up in labor cost per cover and in compliance outcomes.
Xenia's task management tools reduce the administrative burden on managers, so their time goes toward floor operations rather than chasing down checklists and reports.
6. Turnover driving training labor. New employee training consumes hours that produce zero revenue. One new line cook typically needs 20 to 40 hours of training before reaching full productivity. High turnover multiplies this across the year invisibly.
**
Labor cost driver, Controllable?, Typical impact
Unscheduled overtime, Yes with schedule design, 1-3% labor cost increase
Overstaffing slow periods, Yes with labor forecasting, 2-4% labor cost increase
Coverage call-ins, Partially with cross-training, 0.5-2% per incident
Unapproved shift swaps, Yes with approval workflows, Variable
Manager administrative time, Yes with better ops tools, Invisible but real
Turnover-driven training, Partially with retention, 0.5-1% per high-turnover location
**
How do multi-unit operators reduce restaurant labor costs without cutting service quality?
Cutting restaurant labor cost is easy. Cutting it without degrading the guest experience or burning out your team is a system problem.
Six strategies that work at the multi-unit level:
1. Schedule to actual demand, not estimated demand. Build schedules from POS data, covers by hour, day of week, and season. This is labor forecasting in practice.
A scheduler using last Tuesday's actual data rather than a general estimate runs 3 to 5% tighter labor without reducing shift coverage. The data already exists in your POS. Most operators just aren't using it to build schedules.
2. Set labor cost thresholds by location and enforce them. Every location should have a defined labor cost percentage target with a band, for example, 30 to 33%.
When a location drifts above the upper band, a manager review gets triggered. Not at the end of the month. That week. When something can still be done about it.
3. Control overtime through schedule design. Set alerts when an employee approaches 38 hours. Design schedules in advance to avoid shift overlaps that create unplanned overtime.
This is an overtime management and scheduling discipline problem, not a payroll problem. Payroll just reports what already happened.
4. Track restaurant labor cost by daypart. A location running 38% labor at lunch and 28% at dinner doesn't have a portfolio-level problem. It has a lunch scheduling gap.
Daypart visibility is the diagnostic tool that lets you find the actual issue rather than treating the whole location as broken.
5. Reduce administrative labor with better operations tools. If a manager spends 45 minutes per shift managing checklists and drafting reports, those are salaried hours going toward paperwork while operational tasks go unmonitored.
The cost is invisible in the labor cost percentage but very visible in guest experience and compliance outcomes.
Xenia's operational reporting tools give district managers location-level visibility into where restaurant labor cost is running high, and whether it connects to compliance gaps or scheduling decisions.
6. Build cross-training into scheduling. An FOH employee who can cover expo or bar when needed gives a manager flexibility without a call-in. Cross-training is a shift coverage investment that pays back every time a scheduled employee calls out.
How does restaurant labor cost connect to operational compliance?
This is the part most operators don't expect.
Understaffed restaurants don't just have a guest experience problem. They have a compliance problem.
When a location is understaffed relative to service demand, GMs make triage decisions under pressure. The tasks that get cut first are the ones that require time but don't have an immediate visible consequence: closing cleans, temperature logs, end-of-shift documentation, handwashing reminders.
Two very different labor situations create the same compliance risk:
A location running high restaurant labor cost from overtime and coverage scrambles has managers in reactive mode, focused on coverage, not compliance.
A location running low labor cost from understaffing has managers cutting corners on documentation to keep service moving.
Both create compliance gaps. Just from opposite directions.
The scheduling-coverage-compliance connection:
The right staffing level for any shift covers both service demand and compliance tasks within the shift's time budget. That's not just a headcount question. It's a labor forecasting and scheduling design question.
A location that consistently fails temperature log completion during Friday dinner service doesn't necessarily have a training problem. It might have a scheduling gap, not enough people to run the floor and complete documentation at the same time.
Understanding this connection is what separates restaurant labor cost management from pure financial analysis. The number in the restaurant P&L is connected to what happens on the floor every shift.
Why is restaurant labor cost hard to control at scale
Even operators who understand the problem run into real friction when they try to fix it across multiple locations.
**
Challenge, Why it's hard, What helps
Multi-location variance invisible in aggregate, Portfolio averages hide location-level problems, Location-level reporting with threshold alerts
Scheduling and payroll don't talk to each other, Overtime discovered Friday can't be fixed Wednesday, Real-time labor cost tracking by shift
The overtime surprise, Most operators find out after payroll runs, Alerts at 38 hours-not after the fact
Compliance cost of understaffing, Cutting labor to hit the % creates inspection risk, Connect staffing levels to compliance task completion
Salaried manager inefficiency is invisible, Administrative time doesn't show in labor % but shows in outcomes, Reduce admin burden with better ops tools
**
The operators who struggle most are managing restaurant labor cost as a financial metric without connecting it to operational decisions. The number in the P&L is the output. The scheduling, shift coverage, and overtime management decisions are the inputs. Fix the inputs, and the number follows.
How Xenia helps
Tracking restaurant labor cost at the portfolio level tells you something went wrong. Tracking it by location and connecting it to operational performance tells you where and why.
Xenia gives multi-unit restaurant operators the visibility to see which locations are running above their labor cost percentage target, and whether it connects to scheduling gaps, compliance failures, or manager time being spent on administrative tasks instead of the floor.
Shift-based task management reduces the burden on salaried managers so their hours go toward operations.
Real-time dashboards let district managers spot the locations where understaffing is creating compliance risk before it shows up in an inspection report.
See how Xenia works for multi-unit restaurants.
Conclusion
Restaurant labor cost is simple to calculate. Total labor divided by total revenue multiplied by 100. The hard part is controlling it across multiple locations.
A portfolio average hides everything. One location at 26% and another at 38% can average out to 32% and look fine on paper. It isn't.
The real problems are usually scheduling gaps, untracked shift swaps, and overtime nobody caught until Friday. Fix the system and the number improves. It's that straightforward.
One more thing worth remembering. Labor cost and compliance are connected. Short-staffed shifts produce missed tasks and incomplete logs. Both cost you, either in margin or in an inspection.
The operators who get this right aren't doing anything complicated. They just have better visibility into what's actually happening at each location, every shift.
Frequently Asked Questions
Got a question? Find our FAQs here. If your question hasn't been answered here, contact us.
How do you reduce restaurant labor costs without cutting staff?
Build schedules from real POS data, not guesses. Set a labor cost target for each location and review it when it goes over. Track labor by daypart to find exactly where the gap is.
Cut the time managers spend on admin work so those hours go back to the floor. Cross-train staff so you're not calling in extra people every time someone calls out.
Why is my restaurant labor cost too high?
The most common causes are unscheduled overtime, overstaffing during slow periods, last-minute coverage call-ins, and unapproved shift swaps that never get tracked in payroll.
High turnover driving training hours is also a significant invisible contributor. Almost always a scheduling and visibility problem, not a wage problem.
How do you calculate restaurant labor cost?
Divide total labor cost by total revenue, then multiply by 100.
Example: $50,000 labor / $150,000 revenue = 33.3%.
Labor cost includes wages, salaries, overtime, benefits, and payroll taxes.
What is a good labor cost percentage for a restaurant?
It depends on the segment. QSR targets 25 to 30%. Fast casual runs 28 to 33%. Casual dining runs 30 to 35%. Fine dining can reach 40%.
These are ranges, not hard targets. Geography, wage compliance requirements, and service model all affect the right restaurant labor cost percentage for your specific operation.


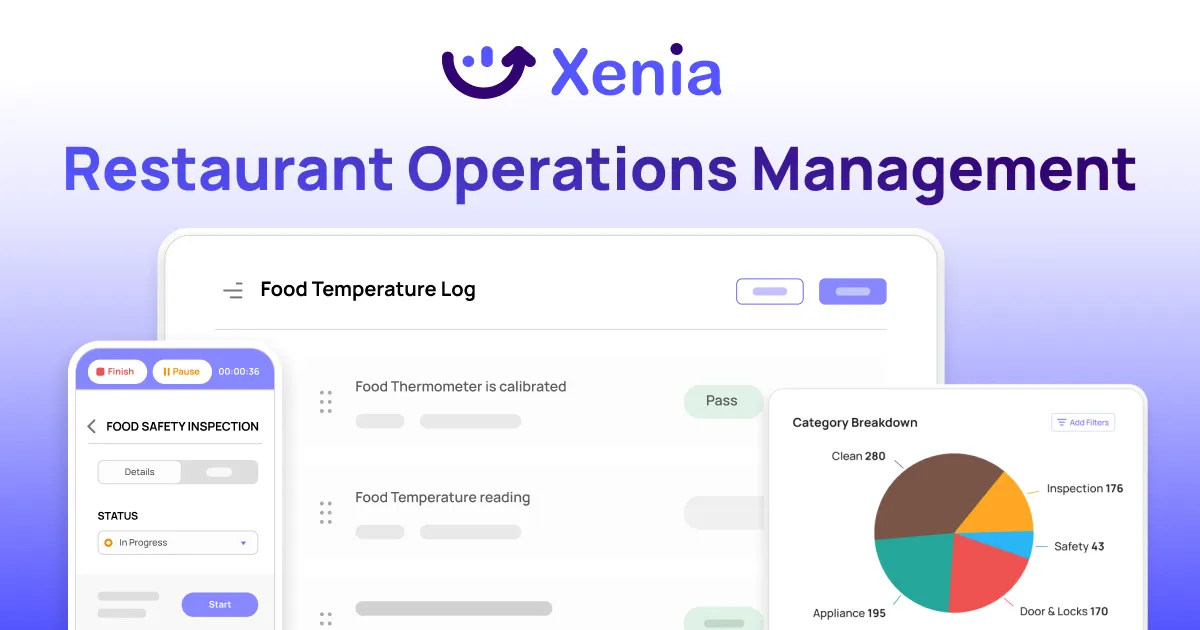
A Modern, AI-Powered Platform Built for Restaurant Operations
Xenia brings kitchen operations, food safety, audits, and team communication into one mobile-first platform. Restaurant teams execute daily work consistently, maintain compliance, and resolve issues faster, while leadership gets real-time visibility across all locations.
.webp)
Why Restaurant Operators Choose Xenia:
🤖 AI-Powered Operations, Convert paper logs instantly and verify food presentation and kitchen cleanliness automatically. Get instant answers about food safety trends without building reports.
🍽️ Food Safety & Compliance, Track line checks and temperature logs with automated alerts. Trigger corrective actions when readings exceed safe ranges. Maintain audit-ready records for health inspections.
📊 Multi-Location Control, Monitor food safety compliance and task completion across regions. Benchmark locations to identify training needs. Export reports for operational reviews.
One platform for kitchen operations, food safety, and compliance across all locations.

.webp)
%201%20(1).webp)

.svg)
%201%20(2).webp)