
Summary
What is the difference between retail and restaurant audits?
The core difference is regulatory hook and cost of failure. A retail audit verifies brand standards (planogram, signage, cash handling, LP) against corporate guidelines and weights-and-measures rules. A restaurant audit verifies food safety, HACCP critical control points, and FDA Food Code priorities, where a single critical fail can void the whole audit and trigger a closure.
Both audits share the same DNA: recurring, evidence-backed checks of brand standards across every location. They diverge on three things:
- What gets measured. Retail leans visual and merchandising-led. Restaurant leans temperature, sanitation, and personal hygiene.
- How a failure scores. Retail uses weighted category scoring with corrective tasks. Restaurant layers weighted scoring with knockout logic, one critical-item failure voids the whole pass.
- How fast a failure has to close. Retail corrective actions usually carry 24 to 72 hour deadlines. Restaurant food-safety priorities are immediate, discard the food, document the corrective action within the shift.
Bindy frames the retail audit as the mechanism that "verifies merchandising, opening/closing procedures, cash handling, and customer service expectations actually happen." Restaurant audits sit on top of the FDA Food Code, which structures priority items, priority foundation items, and core items at the regulator level. Multi-format operators have to translate both frameworks into one weighted audit scoring model.
The cadence asymmetry is the most operationally meaningful piece. A retail box can absorb a 1 to 4 hour district-manager store walk every two to four weeks. A restaurant can't, the cost of one missed cold-holding temperature is foodborne illness and a possible health-department closure. Restaurants bake the audit into the shift: line check, temp log, 30-second photo prompts. See audit frequency by vertical for the cadence by format.
Example walkthrough, retail and restaurant audits in action
Picture a c-store chain with 60 locations that all sell tobacco, beverages, and packaged snacks. Forty of those stores run a hot-food program with roller grills and fried chicken. Twenty are fuel-only. The DM walks every store every two weeks. Same walk, two audit profiles running together on one tablet.
Here's what that single audit looks like in practice:
- The DM opens one audit template. The system already knows whether the location is "fuel + hot food" or "fuel only" based on the location record.
- Retail-side questions fire for every store. Planogram for the tobacco wall, EAS tags on high-theft items, fuel-dispenser sticker compliance, restroom cleanliness, fire-exit clearance, weights-and-measures stickers.
- Restaurant-side questions fire only for hot-food stores. Roller-grill hot-hold temp (≥135°F per FDA Food Code), handwash sink stocked, date marking on prepared items, sanitizer ppm at the three-compartment sink. A fuel-only store never sees these questions and doesn't get penalized for "missing" them. That's nullify scoring with conditional visibility doing its job.
- Weighting drives the score. A planogram gap on the tobacco wall scores at 3 points. A hot-hold temp out of range scores at 10 points and triggers a knockout flag.
- Corrective actions auto-route by failure type. Planogram gap routes to the store manager with a 24-hour deadline. The hot-hold failure routes to the shift lead immediately, requires a photo of the corrective action (discarded food, equipment fixed), and escalates to the DM if not closed within the shift.
That single-walk pattern is why multi-format chains stop running two audit tools. C-store chains with mixed formats can run one audit and hide irrelevant questions per location group instead of duplicating templates.
Conditional visibility solves the patio-vs-no-patio problem on the restaurant side and the tap-system-vs-no-tap problem on the c-store side, both with the same engine. See tap system vs fuel-only c-store audits for the c-store-specific walkthrough.
Multi-unit operators have been forced into stacking Bindy for retail visual audits plus Zenput or RizePoint for food safety. The math collapses when one platform handles both with conditional logic and weighted plus knockout scoring.
How do retail audits differ from restaurant audits feature-by-feature?
Retail audits and restaurant audits differ across nine measurable dimensions. The table below is the artifact most operators screenshot when scoping a multi-format audit program.
**
Dimension, Retail audit, Restaurant audit
Primary regulator, NRF voluntary standards-OSHA-state weights-and-measures, FDA Food Code-USDA-local health department- OSHA
Highest-weight failures, Planogram non-compliance-shrink-fire-exit blockage-price-tag errors, Cold or hot holding out of range- bare-hand contact with RTE food-cross-contamination-handwashing
Typical cadence, Monthly DM visit-quarterly corporate-weekly self-audit, Daily line check-weekly manager audit-monthly corporate-health inspector 1 to 4 times a year
Audit duration, 1 to 4 hours per store visit, 30 minutes daily line check-2 to 4 hours formal brand-standards audit
Photo evidence, Very high-window displays and endcaps benchmarked to reference photos, Moderate-used for cleanliness- equipment and plating standards
Scoring model, Weighted by category (merchandising 40%-ops 25%-safety 20%-service 15%), Weighted plus knockout-one critical-item fail voids the audit
Corrective action SLA, 24 to 72 hours for most items-same-shift for safety hazards, Immediate for food safety priorities-discard and document inside the shift
Top execution risk, Planogram drift-actual compliance lands near 60% vs assumed 80-85%, Recurring FDA top-5 citations: pest control-handwashing-cross-contamination-temperature-sanitation
Tech stack norm, Bindy-SafetyCulture-Yoobic-MangoApps for visual audits, Zenput / Crunchtime-RizePoint-OpsAnalitica-Jolt for food-safety audits
**
Two operator-level reads on the table:
For the retail side. Industry data suggests average planogram compliance sits near 60% when photo-verified, against an assumed 80% to 85% when self-reported. That 20-point gap is the case for photo-based visual audits with reference-image comparison. Retail banners can run visual audits for locations with mannequin displays versus without, or for different planogram sections per store format, using one template instead of duplicating per banner.
For the restaurant side. The FDA continues to cite the same five food-safety violations year over year: pest control, handwashing, cross-contamination, temperature, and sanitation. The IFS framework designates 10 requirements as knockout criteria, where any single failure results in an automatic audit fail regardless of overall score. Local health departments mirror this with priority items worth 4 to 7 points and thresholds that trigger re-inspection or closure.
.svg)

Priced on per user or per location basis
Available on iOS, Android and Web


How to set up retail and restaurant audits in Xenia
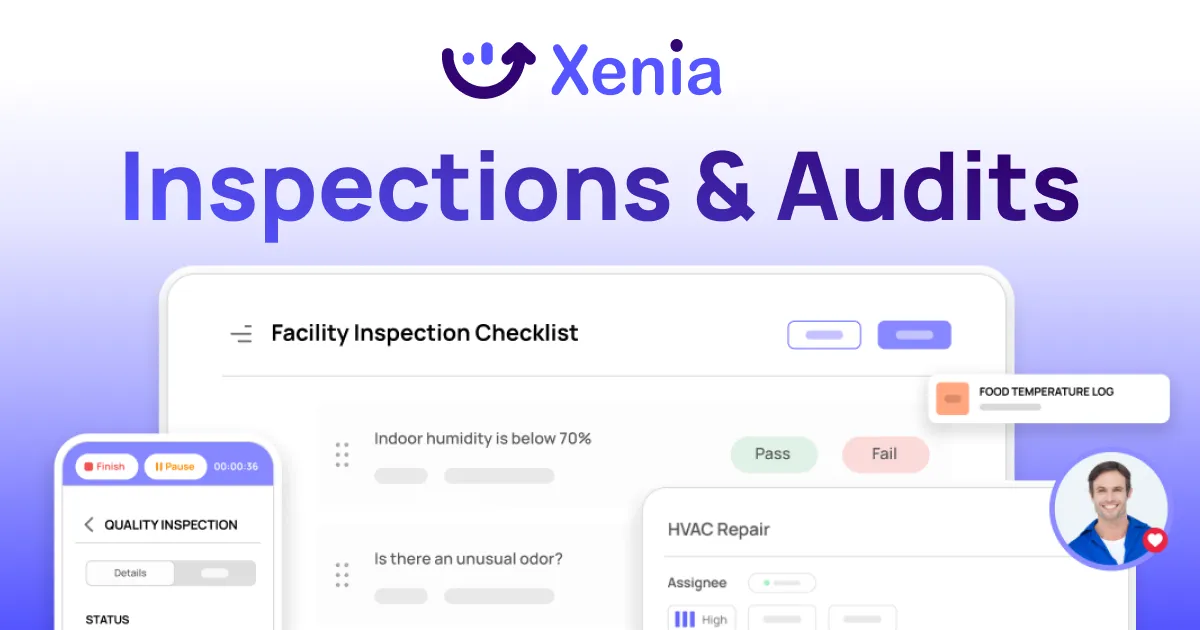
Setup is the same five steps for both formats. The branching happens at question level, not at template level, so multi-format chains don't duplicate work.
- Create the location records first. Tag every store with the format attributes that drive branching: hot food yes or no, tap system yes or no, patio yes or no, drive-thru yes or no, banner, region. This is the spine. Conditional visibility reads from these tags.
- Build one master template per audit type. Build the retail audit template once with every possible visual merchandising, LP, and cash-handling question. Build the restaurant audit template once with every possible food safety, hot-hold, sanitation, and personal hygiene question. You won't duplicate templates per format.
- Apply conditional visibility per question. "Hot-hold temperature" only appears when the location is tagged hot food. "Tobacco wall planogram" only appears when the location sells tobacco. "Patio cleanliness" only appears when patio equals yes. Stores without that attribute never see the question and don't get penalized at scoring time.
- Assign weights and knockouts. Food safety items get 10 points and a knockout flag. Visual merchandising gets 3 to 5 points by category weight. Cosmetic items get 1 point. The audit score now tracks what matters.
- Wire corrective actions to roles and SLAs. A planogram gap routes to the store manager with a 24-hour deadline. A temp-out-of-range routes to the shift lead immediately, requires a follow-up question and a photo of the corrective action, then escalates to the DM at the deadline. See corrective action tracking for the full closure workflow.
- Roll out to pilot stores, then expand. Three to five stores, two weeks, fix the template based on real DM walks, then scale to the full footprint. Most multi-format chains hit full deployment in 14 to 30 days.
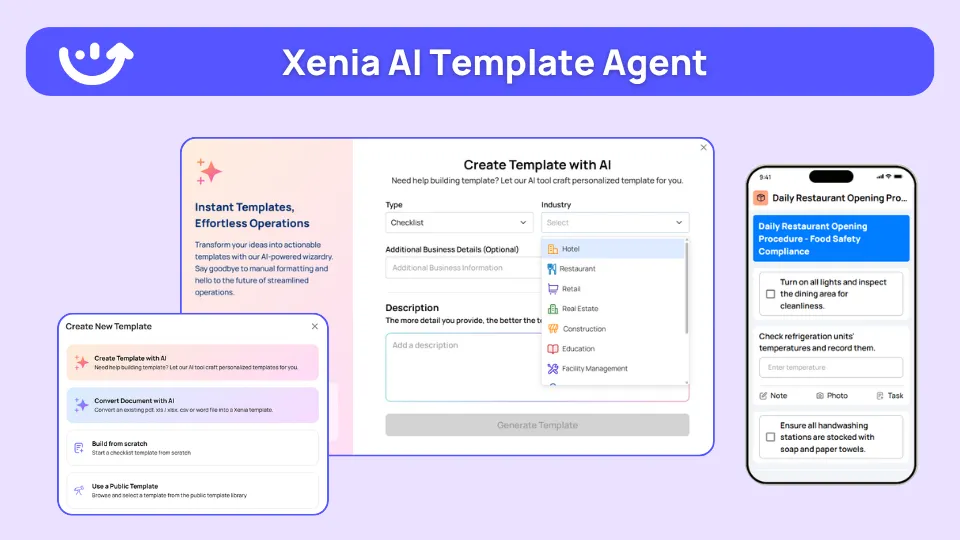
Xenia's AI Template Agent reads an SOP PDF and converts it to a digital audit form with conditional logic and required fields. A franchise rollout that used to take weeks of template-building shifts to days. The agent handles both retail planogram SOPs (turning the planogram diagram into a photo-required question per fixture) and restaurant SOPs (turning a hot-hold procedure into a question with a temperature input and a corrective branch).
Where do operators see results?
Multi-format and multi-banner operators see results in three places: time saved per audit, score range that finally reflects reality, and corrective actions closing on deadline.
A restaurant chain moving off flat scoring. Multi-unit restaurant operators who replace a flat percentage with weighted plus knockout scoring consistently report the same shift: a score that used to sit fixed around 87% regardless of what was actually happening on the floor opens into a real distribution once weighted scoring is on. Bluetooth thermometers paired with the audit engine log walk-in temps automatically. Out-of-range readings trigger a follow-up question, require a photo of the corrective action, and assign a task to the kitchen manager with a 24-hour deadline. The food safety score becomes a process, not a number on a dashboard.
Power Market, c-store, 360+ locations. Power Market consolidated audits, maintenance, comms, and reporting onto Xenia across its convenience store footprint and reported 40% faster operational task resolution. The same conditional-visibility engine that handles patio-vs-no-patio on the restaurant side handles tap-system-vs-fuel-only here, one template, both formats, no duplicate checklists per site type.
A multi-banner retail operator consolidating from per-seat pricing. Retail chains moving off per-seat audit tools run into the same math problem at scale: every new district manager needing visibility means another license. Consolidating to flat per-location pricing removes that penalty entirely, so adding a DM to cover growth doesn't add cost. Multi-banner retail operators evaluating this move should pair it with the Xenia vs Bindy comparison for the full per-seat vs flat-per-location breakdown.
Shucking Good Hospitality, restaurant, reached a 94% completion rate on daily opening, closing, and food safety procedures after digitizing the workflow, evidence that the same conditional-and-weighted audit model holds up across hospitality formats too, not just QSR and retail.
Operators evaluating an audit consolidation should pull two reports the first week after rollout: score range distribution by store (how much variance exists once weighted scoring is on) and corrective action closure rate by deadline. Those two numbers tell you whether the audit is finally tracking reality.
Frequently Asked Questions
Got a question? Find our FAQs here. If your question hasn't been answered here, contact us.
What is the core difference between retail and restaurant audit software?

Can one platform handle both planogram and food safety audits?
How should retail operators weight signage and fixture items?
How should restaurant operators weight temperature and food safety items?
Do conditional questions work for both retail formats and restaurant formats?
Can a multi-banner operator compare retail and restaurant audit scores side-by-side?


A Modern, AI-Powered Platform Built for Restaurant Operations
Xenia brings kitchen operations, food safety, audits, and team communication into one mobile-first platform. Restaurant teams execute daily work consistently, maintain compliance, and resolve issues faster, while leadership gets real-time visibility across all locations.
.webp)
Why Restaurant Operators Choose Xenia:
🤖 AI-Powered Operations, Convert paper logs instantly and verify food presentation and kitchen cleanliness automatically. Get instant answers about food safety trends without building reports.
🍽️ Food Safety & Compliance, Track line checks and temperature logs with automated alerts. Trigger corrective actions when readings exceed safe ranges. Maintain audit-ready records for health inspections.
📊 Multi-Location Control, Monitor food safety compliance and task completion across regions. Benchmark locations to identify training needs. Export reports for operational reviews.
One platform for kitchen operations, food safety, and compliance across all locations.

.svg)
.webp)
%201%20(1).webp)

.svg)
%201%20(2).webp)