
The analyst your operations Never had to hire

.avif)

.svg)
From your numbers to the next move

Reads: Your Numbers
Checklists, audits, customer feedback, and training data land in one place, alongside outside sources like POS, reviews, and payroll. The numbers your operations already generate stop sitting in separate systems.

Watches Every Site
Trends, outliers, and repeat offenders surface continuously, not at period close. A location starting to slip shows up while the shift can still fix it.

Recommends The Fix
When something needs attention, the agent surfaces the specific fix and the exact sites that need it. A person approves it, and the corrective action goes out.
The reports you no longer build by hand
Ask In Plain English
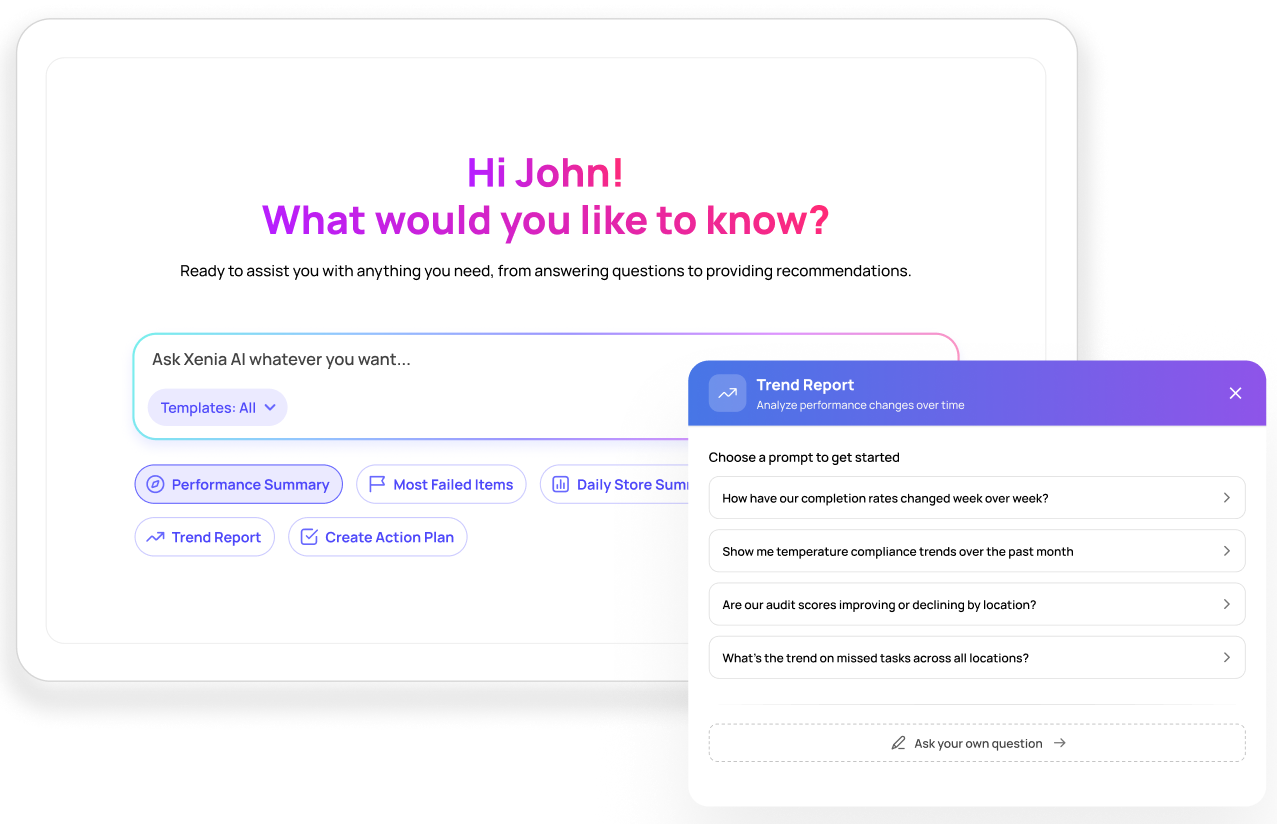
A question asked the way it would be said out loud comes back answered across every submission. "Highest and lowest performing locations this month, and what drove the gap" returns without a query builder or an analyst seat.
Reports Write Themselves
Weekly ops reviews, audit summaries, and executive rollups generate on their own, built as a PDF or a presentation. The deck that ate someone's Sunday night arrives finished.
.svg)
Trend And Outlier Detection
The slide that starts in week two gets caught in week two, not at the quarter-end review. The repeat offenders and the failures driving them surface on their own.

Peer Benchmarking
Every location is ranked against its peers, not a company average that flatters the weak sites and punishes the strong ones. A ranking that reflects like-for-like is one a district manager can act on.
Proactive Flags
Trends surface without anyone asking, like a step skipped five days running. Each flag opens to the submissions behind it.
Scheduled By Role
Insights arrive on a set cadence, sent to the right role by email, text, or in the app. A district manager and a corporate director each get the read that fits, not the same dashboard.
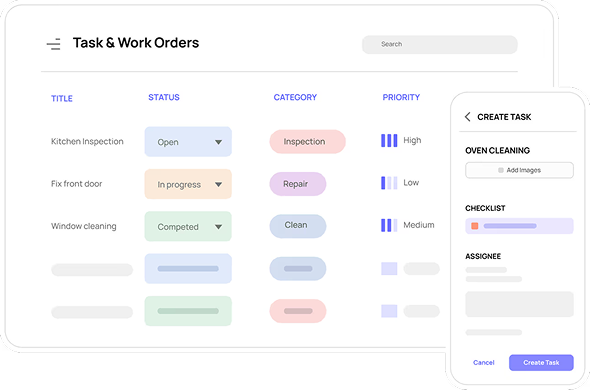
Schedule recurring tasks across all locations or target specific attributes like stores with 24-hour operations or drive-thrus.

%201.png)
Frequently Asked Questions
What data does it work with?

The data your operations already generate inside Xenia, including checklists, audits, customer feedback, and training, plus outside sources brought in through the Data Cloud: POS and transactional data, reviews and surveys, sensors, and payroll. It reads across tens of thousands of submissions at once.
Can we approve actions before they deploy?
Yes. The agent recommends the fix and the sites that need it, and a person signs off before anything is sent. The amount of sign-off is configurable by action type, so routine items move fast and sensitive ones wait for review.
Does it replace our BI tool?
For the operational questions most teams take to a BI tool, yes. The reports, trends, and rankings come back in plain English, with no query builder and no analyst seat, and the scheduled insights increasingly stand in for dashboards built by hand.
How does it avoid noise from small samples?
It reasons over trends across many submissions rather than reacting to a single one, and it ranks each location against comparable peers instead of raw one-off numbers. Every flag opens to the submissions behind it, so a signal can be checked before anyone acts on it.
Does pricing scale as we add locations?
Xenia prices per location with unlimited users included, so adding general managers, district leads, or new hires doesn't change your bill the way per-user pricing does. Add locations as you grow without renegotiating for every new user.
Can Xenia handle food safety and temperature logs the way we're used to, whether we know the tool as Jolt or SmartSense?
Yes. Bluetooth thermometers and wireless sensors log readings automatically with timestamps, and continuous monitoring alerts your team the moment a cooler or freezer drifts out of range. Xenia works with the sensors and hardware you already have, so there's nothing new to buy into.
Got a question? Send us your query.
AI That Works While Your Team Runs the Restaurant


Vision Agent
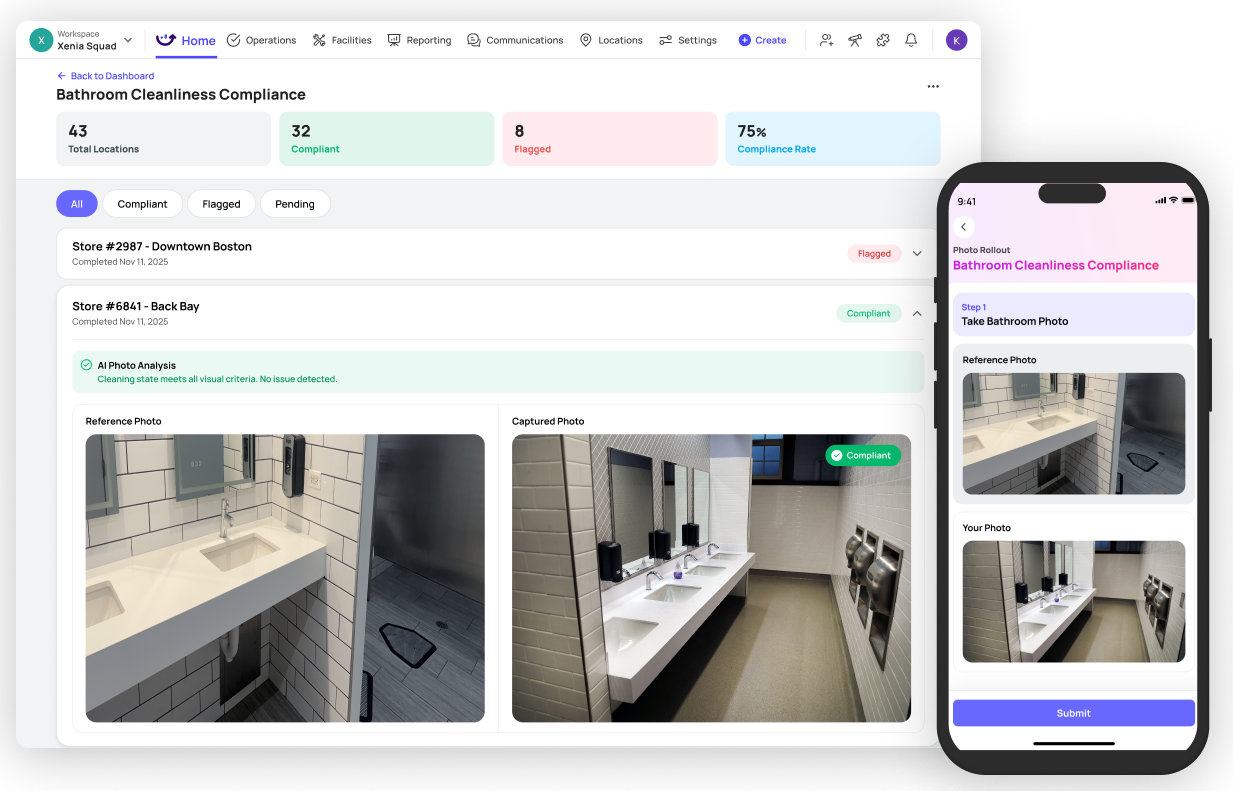
Reviews the photos and video across your sites for the standards you set, and turns every miss into a corrective task.

Compliance Agent
Verifies every submission the moment it lands, so a completed checklist means the work happened

AI Template Agent
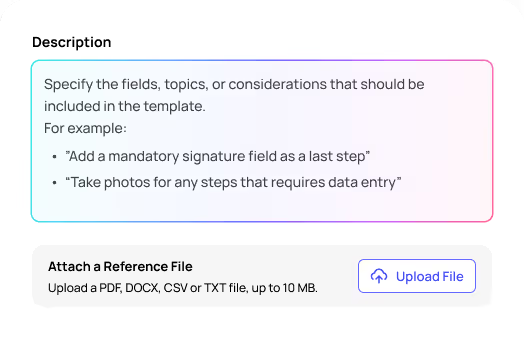
Converts the files your operations already run on into working mobile checklists, near-verbatim.

AI Summaries
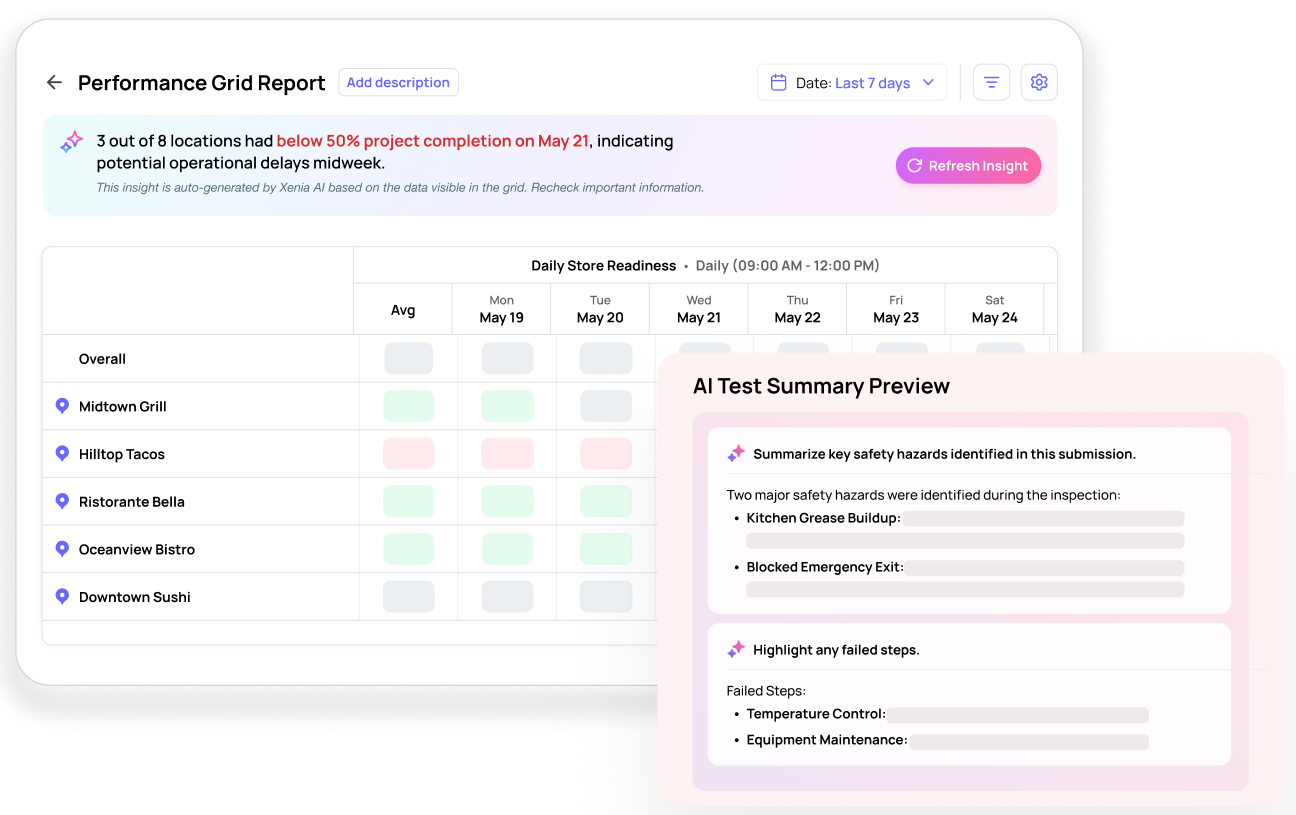
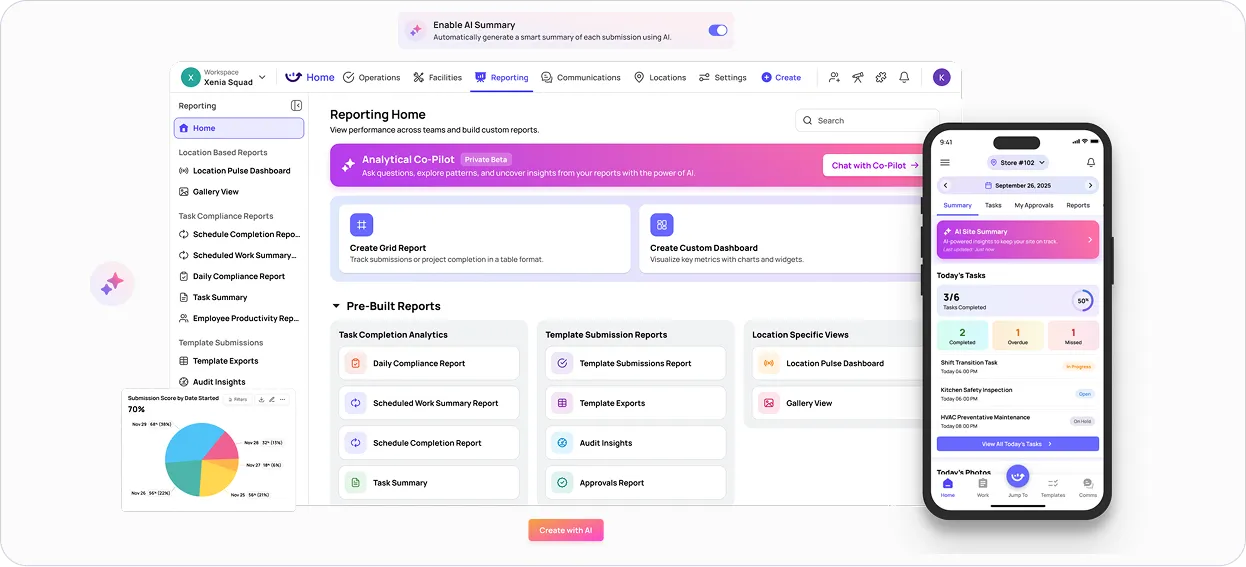
Generate per-location and network-wide summaries automatically, with prompts your team controls, so leadership gets the story behind the numbers without anyone building a deck.

AI Photo Rollouts
Shows photos and analyzes them at scale to measure consistency across all your locations.
AI Photo Rollouts
Shows photos and analyzes them at scale to measure consistency across all your locations.
AI Photo Rollouts
Shows photos and analyzes them at scale to measure consistency across all your locations.
AI Photo Rollouts
Shows photos and analyzes them at scale to measure consistency across all your locations.
See every location in one read
Bring a week of real data to the demo and watch the trends, rankings, and recommended fixes come back in plain English.